


 Western Digital: Fiscal 1Q24 Financial Results
Sales up 3% Q/Q and down 26% Y/Y, huge loss, relatively good outlook
This is a Press Release edited by StorageNewsletter.com on October 31, 2023 at 2:02 pmNews Summary
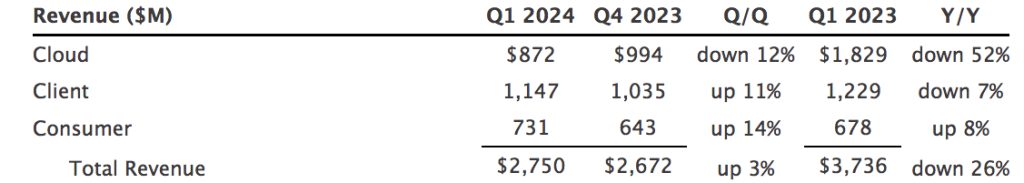
- First quarter revenue was $2.75 billion, up 3% Q/Q. Cloud revenue decreased 12% Q/Q. Client revenue increased 11% Q/Q. Consumer revenue increased 14% Q/Q.
- 1FQ24 GAAP earnings per share (EPS) was $(2.17) and non-GAAP EPS was $(1.76), which includes $225 million of underutilization-related charges in flash and HDD.
- Expect 2FQ24 revenue to be in the range of $2.85 billion to $3.05 billion.
- Expect non-GAAP EPS in the range of $(1.35) to $(1.05), which includes $110 to $130 million of underutilization-related charges in flash and HDD.
Western Digital Corp. reported fiscal first quarter 2024 financial results.
“Western Digital’s fiscal first quarter results exceeded our expectations as the team’s efforts to bolster business agility and develop differentiated and innovative products across a broad range of end-markets have resulted in sequential margin improvement across flash and HDD businesses,” said David Goeckeler, CEO. “Our consumer and client end markets continue to perform well and we now expect our cloud end market to grow going forward. Our improved cost structure positions Western Digital to capitalize on enhanced earnings power as market conditions continue to improve.”
The company had an operating cash outflow of $626 million and ended the quarter with $2.03 billion of total cash and cash equivalents.
In 1FQ24:
- Cloud represented 32% of total revenue. Sequentially, the decline was primarily due to lower nearline hard drive shipments to data center customers. The Y/Y decrease was primarily due to declines in shipments for both HDD and flash products.
- Client represented 42% of total revenue. Sequentially, the increase was due to growth in flash bit shipments. The Y/Y decrease was primarily due to declines in flash pricing.
- Consumer represented 26% of total revenue. On both a sequential and Y/Y basis, the increase was driven by both higher content per unit and unit shipments in flash.
Comments
1FQ24 results exceeded the guidance ranges ($2,400 to $2,600 million) provided in July with total revenue of $2,750 million billion, up 3% Q/Q and down 26% Y/Y.
Flash and HDD metrics
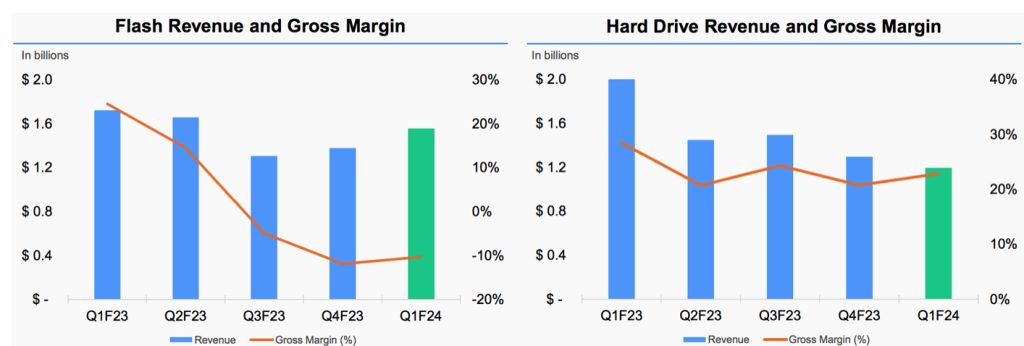
Flash
- Revenue at $1.6 billion, up 13% Q/Q, and down 10% Y/Y
- Record bit shipments increased 26% Q/Q and 49% Y/Y
- WD_BLACK bit shipments more than doubled and content per unit increased over 50% Y/Y
- Ramping an array of client SSDs, based on BiCS6, to lead the industry transition to QLC in calendar year 2024 -
HDD
- Revenue at $1.2 billion, down 8% Q/Q and 41% Y/Y due to lower nearline exabyte shipments driven by subdued demand from cloud customers and slower-than-expected recovery in China
- 26TB UltraSMR drive accounted for nearly half of nearline exabyte shipments with total SMR shipments exceeding the 40% goal laid out in 1FQ23 and becoming the highest near-line volume runner in 2 quarters
- On track with the 28TB UltraSMR drive qualification with a roadmap into the 40TB range.
- Total exabyte shipments decreased 5% Q/Q and 42% Y/Y and average price per unit decreased 10%
- ASP per drive at $112 up 13% Q/Q
Looking ahead to 1FQ24, in flash the company expects both modest bit and ASP improvement and a decline in underutilization charges to drive continued sequential improvement in both revenue and gross margin. In HDD, it expects higher nearline shipments and seasonal demand in consumer end market to drive sequential revenue growth.
2FQ24 revenue is projected to be in the range of $2.85 billion to $3.05 billion, growth between 4% and 11% to be led by higher nearline HDD shipments and improved pricing in flash.
| in $ million | 4FQ21 |
1FQ22 |
2FQ22 |
3FQ22 |
4FQ22 |
1FQ23 | 2FQ23 | 3FQ23 |
4FQ23 | 1FQ24 |
4FQ23/1FQ24 growth |
| HDDs |
2,501 | 2,561 | 2,213 | 2,138 | 2,128 | 2,014 | 1,657 | 1,496 | 1,295 |
1,194 |
-8% |
| Flash |
2,419 | 2,490 | 2,620 | 2,243 | 2,400 | 1,722 | 1,450 | 1,307 | 1,377 | 1,556 |
13% |
By business, and HDD
| Client revenue (1) |
Cloud revenue (1) |
Consumer revenue (1) |
Total HDDs (2) |
HDD ASP |
|
| 1FQ22 |
1,853 | 2,225 | 973 | 24.1 |
$102 |
| 2FQ22 |
1,854 | 1,920 | 1,059 | 21.6 |
$97 |
| 3FQ22 |
1,732 | 1,774 | 875 | 19.8 |
$101 |
| 4FQ22 |
1,637 | 2,098 | 793 | 16.5 |
$120 |
| 1FQ23 |
1,229 | 1,829 | 678 | 14.7 | $125 |
| 2FQ23 |
1,089 | 1,224 | 794 | 12.9 | $99 |
| 3FQ23 |
975 | 1,205 | 623 | 12.6 | $109 |
| 4FQ23 |
1,035 | 994 | 643 | 11.8 | $99 |
| 1FQ24 |
1,147 | 872 | 731 | 10.4 | $112 |
Comparison of Seagate and WD for their more recent financial quarters
| WD | Seagate | % in favor of WD | |
| Revenue | 2,750 | 1,454 | 89% |
| Y/Y Growth | -26% | -29% | |
| Net loss | 685 | 184 | |
| Flash revenue | 1,556 | 159 | 979% |
| Y/Y growth | -41% | -40% | |
| HDD revenue | 1,194 | 1,295 | -8% |
| Y/Y growth | -10% | -27% | |
| Total HDDs shipped | 16.5 million | 11.9 million | 39% |
| HDD ASP | $112 | $108 | 4% |


 Subscribe to our free daily newsletter


