


 Western Digital: Fiscal 4Q23 Financial Results
All figures down for HDDs and SSDs, but stabilization expected next quarter
This is a Press Release edited by StorageNewsletter.com on August 1, 2023 at 2:02 pm| (in $ million) | 4Q22 | 4Q23 | FY22 | FY23 |
| Revenue | 4,528 | 2,672 | 18,793 | 12,318 |
| Growth | -41% | -34% | ||
| Net income (loss) | 301 | (730) | 1500 | (1,730) |
Highlights:
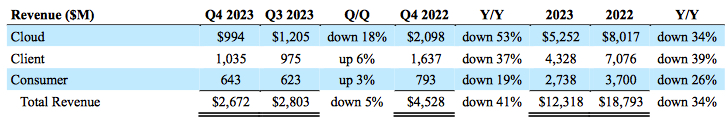
• 4FQ23 revenue was $2.7 billion, down 5% Q/Q. Cloud revenue decreased 18% Q/Q, Client revenue increased 6% and Consumer revenue increased 3% Q/Q. FY23 revenue was $12.3 billion.
• 4FQ23 GAAP earnings per share was $(2.27) and Non-GAAP EPS was $(1.98), which includes $211 million of underutilization related charges in flash and HDD. FY23 GAAP EPS was $(5.44) and Non-GAAP EPS was $(3.59).
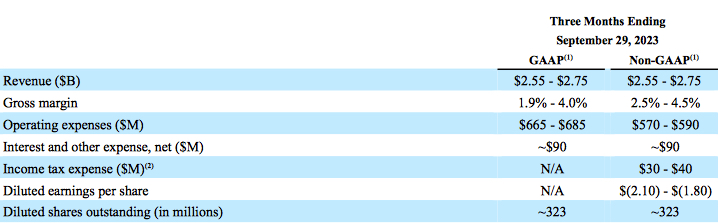
• Expect fiscal 1FQ24 revenue to be in the range of $2.55 billion to $2.75 billion.
• Expect Non-GAAP EPS in the range of $(2.10) to $(1.80) which includes $200 to $220 million of,underutilization charges in flash and HDD.
Western Digital Corp. reported fiscal fourth quarter and fiscal year 2023 financial results.
“Throughout the fiscal fourth quarter and fiscal year, Western Digital continued to optimize our operations and successfully execute our innovative product roadmap, priming ourselves for greater profitability when demand rebounds across HDDs and flash. As a result of these efforts, we delivered revenue above our expectation and delivered a range of industry-leading products to our customers,” said David Goeckeler, Western Digital. “We are encouraged by several indicators signaling improving flash market dynamics. Our two largest end markets, Client and Consumer, are returning to growth, inventories are normalizing, content per unit is increasing and price declines have been moderating. Western Digital is well-positioned to capitalize on improving market conditions and capture long-term growth opportunities in storage, spanning from client to edge to cloud.”
In 4FQ23:
• Cloud represented 37% of total revenue. Sequentially, the decline was primarily due to a decrease in capacity enterprise drive shipments. The Y/Y decrease was primarily due to declines in both HDD and flash product shipments.
• Client represented 39% of total revenue. Sequentially, the increase was driven by growth in bit shipments for gaming consoles. The Y/Y decrease was due to declines in flash pricing, and lower client SSD and HDD unit shipments for PC applications.
• Consumer represented 24% of total revenue. Sequentially, the increase was primarily due to higher retail SSD shipments. The Y/Y decrease was driven by price declines in flash and lower retail HDD shipments.
In FY23:
• Cloud represented 43% of total revenue. The Y/Y decrease was primarily due to reduced shipments of capacity enterprise HDDs and enterprise SSDs.
• Client represented 35% of total revenue. The Y/Y decrease was primarily due to declines in flash pricing, as well as lower client SSD and HDD unit shipments for PC applications.
• Consumer represented 22% of total revenue. Revenue decreased Y/Y, as growth in retail SSD bit shipments was more than offset by broad-based flash price decline and lower consumer HDD shipments.
Business Outlook for Fiscal First Quarter of 2024
Comments
WD continues to be in financial trouble. Revenue for the former quarter was $2.8 billion, down 10% Q/Q and 36% Y/Y. Here it's not much better: -5% and -41%, respectively, even if it exceeded expectations ($2,400 to $2,600 million) with sales of $2.672 million in 4FQ23. For FY23, the figure is $12,318 million as much as down 34% Y/Y but corresponding to expectations ($12,046 million to 12,246 million).
Revenue by business
Flash and HDD metrics
Cloud
Looking at end markets for FY23, cloud revenue decreased 34% Y/Y, primarily due to reduced shipments of capacity enterprise HDDs and enterprise SSDs. For 4FQ23, cloud represented 37% of total revenue at $1 billion, down 18% Q/Q and 53% Y/Y. Sequentially, the decline was primarily due to a decrease in capacity enterprise HDD shipments. Nearline bit shipments were 59EB, down 26% Q/Q, driven by ongoing weakness at cloud customers. The Y/Y decrease was primarily due to declines in both HDD and flash product shipments.
Client
Client revenue decreased 39% Y/Y, primarily due to declines in flash pricing, as well as lower client SSD and HDD unit shipments for PC applications. Client represented 39% of total revenue at $1 billion, up 6% Q/Q and down 37% Y/Y. Sequentially, the increase was driven by growth in bit shipments for gaming consoles. The yearly decrease was due to declines in flash pricing and lower client SSD and HDD unit shipments for PC applications.
Consumer
Consumer revenue decreased 26% for the year as growth in retail SSD bit shipments was more than offset by broad-based flash price decline and lower consumer HDD shipments. Consumer represented 24% of total revenue at $0.6 billion, up 3% Q/Q and down 19% Y/Y. Sequentially, the increase was primarily due to higher retail SSD shipments. The Y/Y decrease was driven by price declines in flash and lower retail HDD shipments.
Flash
WD pioneered the use of wafer bonding and advanced 3D NAND manufacturing and introduced BiCS8, which sets the foundation for future 3D NAND scaling.
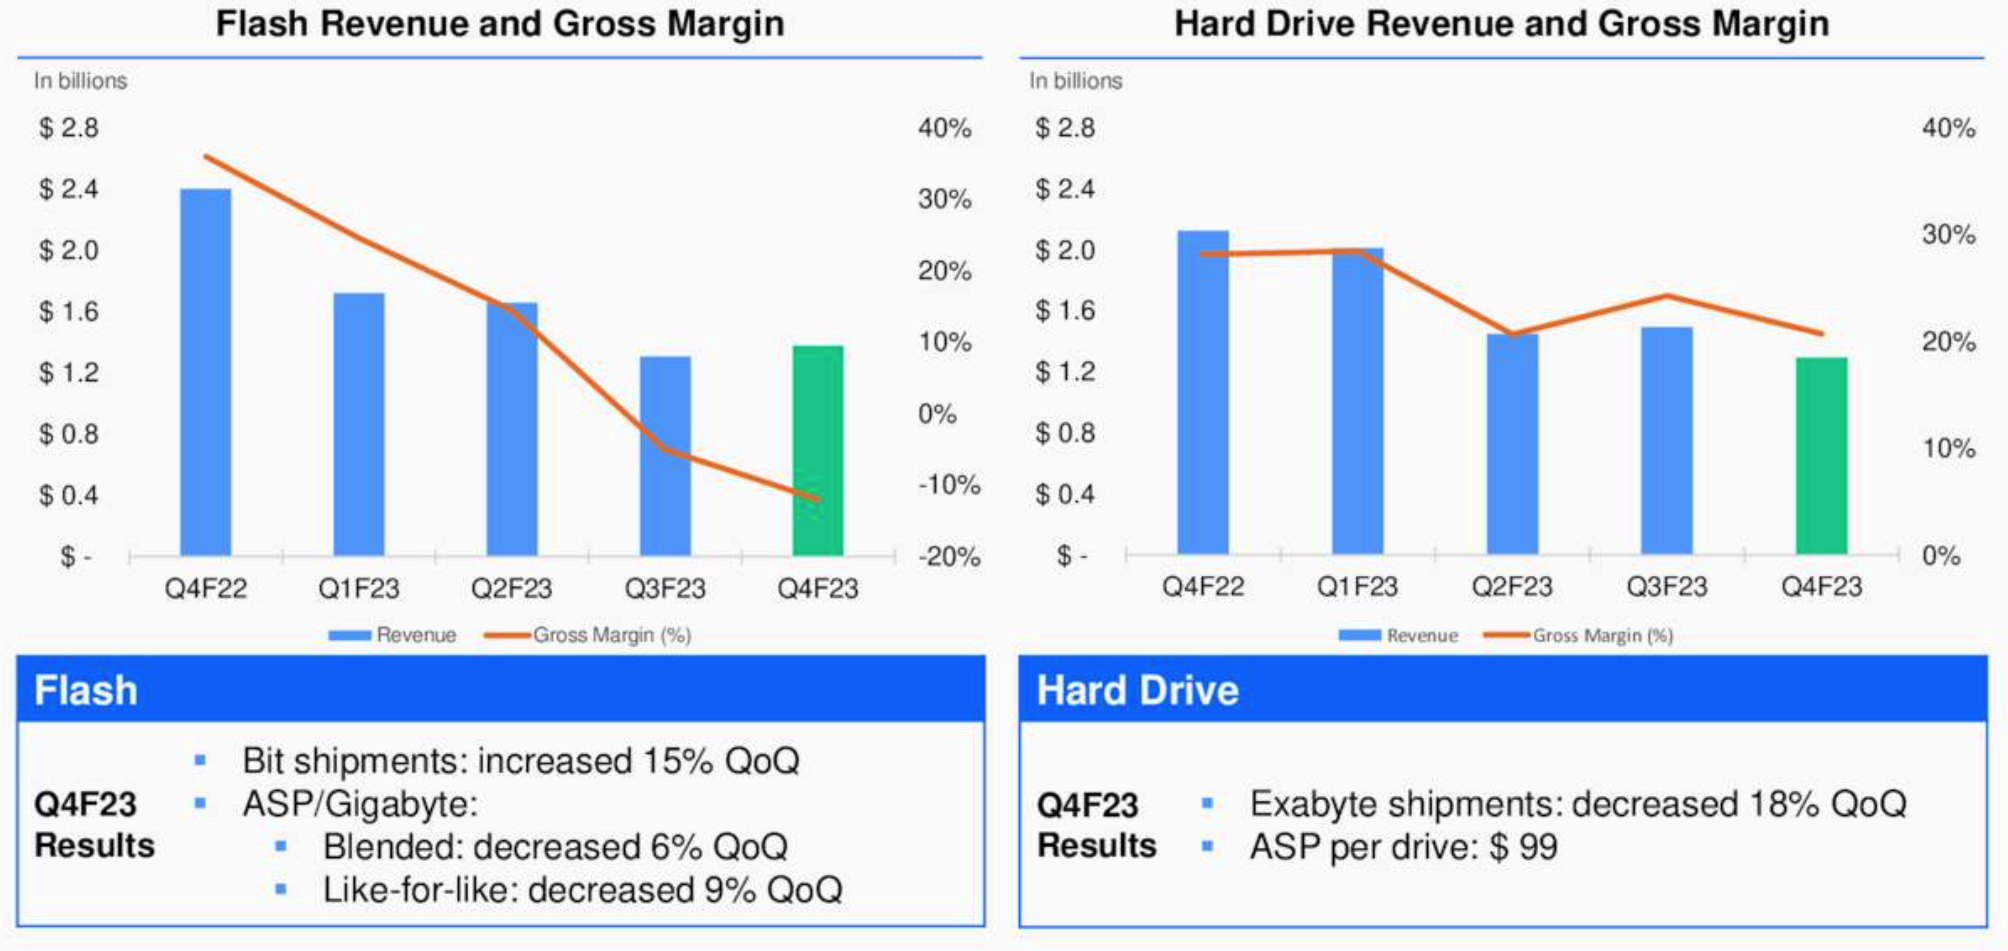
For flash, revenue increased Q/Q led by growth in both client and consumer flash bit shipments, which exceeded expectations with total bit shipments returning to Y/Y growth. The stronger-than-expected bit growth is attributable to normalizing PC and consumer demand, as well as content growth. Average capacity per consumer and client SSD increased over 40% and 20% Y/Y, respectively.
HDDs
WD has qualified its latest family of capacity enterprise HDDs that all major customers and are shipping its 26TB Ultra SMR drive in high volume. In addition, it is about to begin product sampling of 28TB Ultra SMR drive.
In 4FQ23, HDD revenue was $1.3 billion, down 13% Q/Q and 39% Y/Y. Sequentially, total HDD exabyte shipments decreased 18% and average price per unit decreased 9% to $99. On a Y/Y basis, HDD exabyte shipments decreased 38% and average price per unit decreased 17%.
In 4FQ23, ongoing cloud weakness drove the overall decline in HDD revenue. However, demand for both client and consumer hard drives has stabilized and exceeded our expectations.
At the end-of-the quarter, total liquidity was $4.9 billion, including cash and cash equivalents of $2 billion.
Outlook
In HDD, WD expects 1FQ24 overall demand to remain stable. Beyond this quarter, it anticipates both improving demand and new product ramps to drive growth in revenue and profitability.
In flash, it is encouraged by several indicators signaling improving market dynamics. Notably, its 2 largest end markets, client and consumer are returning to growth, inventories are normalizing, content per unit is increasing and price declines have been moderating.
For 1FQ24, sequentially, it expects both HDD and flash revenue to be relatively stable. In this quarter, it is continuing to adjust production to better match demand and anticipate underutilization charges to impact both HDD and flash gross margins along with product mix pressures on flash ASP.
Beyond 1FQ24, it anticipate both HDD and flash revenue to improve through the remainder of FY24, driven by normalizing demand in storage, as well as higher average content per unit in flash. Gross margin is expected to gradually improve driven by higher HDD volume and lower underutilization charges in both flash and HDD. It will continue to tightly manage cost structure and expenses as it navigates the challenging environment. For FY24, it expects capital expenditures to decline significantly.
For 1FQ24, non-GAAP guidance is as follows. The company expects revenue to be in the range of $2.55 billion to $2.75 billion or between -5% and +3%.
| in $ million | 1FQ21 | 2FQ21 | 3FQ21 |
4FQ21 |
1FQ22 |
2FQ22 |
3FQ22 |
4FQ22 |
1FQ23 | 2FQ23 | 3FQ23 |
4FQ23 | 3FQ23/4FQ23 growth |
| HDDs |
1,844 | 1,909 | 1,962 | 2,501 | 2,561 | 2,213 | 2,138 | 2,128 | 2,014 | 1,657 | 1,496 | 1,377 |
-8% |
| Flash |
2,078 | 2,034 | 2,175 | 2,419 | 2,490 | 2,620 | 2,243 | 2,400 | 1,722 | 1,450 | 1,307 | 1,295 | -1% |
By business, and HDD
| Client revenue (1) |
Cloud revenue (1) |
Consumer revenue (1) |
Total HDDs (2) |
HDD ASP |
|
| 1FQ22 |
1,853 | 2,225 | 973 | 24.1 |
$102 |
| 2FQ22 |
1,854 | 1,920 | 1,059 | 21.6 |
$97 |
| 3FQ22 |
1,732 | 1,774 | 875 | 19.8 |
$101 |
| 4FQ22 |
1,637 | 2,098 | 793 | 16.5 |
$120 |
| 1FQ23 |
1,229 | 1,829 | 678 | 14.7 | $125 |
| 2FQ23 |
1,089 | 1,224 | 794 | 12.9 | $99 |
| 3FQ23 |
975 | 1,205 | 623 | 12.6 | $109 |
| 4FQ23 |
1,035 | 994 | 543 | 11.8 | $99 |


 Subscribe to our free daily newsletter


