


 Western Digital: Fiscal 3Q23 Financial Results
Sales down 36% Y/Y and 10% Q/Q, bad period following morose HDD and SSD markets
This is a Press Release edited by StorageNewsletter.com on May 9, 2023 at 2:02 pm| (in $ million) | 3Q22 | 3Q23 | 9 mo. 22 | 9 mo. 23 |
| Revenue | 4,381 | 2,803 | 14,265 | 9,646 |
| Growth | -36% | -32% | ||
| Net income (loss) | 25 | (572) | 1,199 | (991) |
Highlights:
• 3FQ23 revenue was $2.8 billion, at the high end of the guidance range.
• 3FQ23 GAAP earnings per share (EPS) was $(1.82) and Non-GAAP EPS was $(1.37), which includes $200 million of underutilization related charges in flash and HDD.
• 3FQ23 GAAP operating loss was $472 million and Non-GAAP operating loss was $304 million.
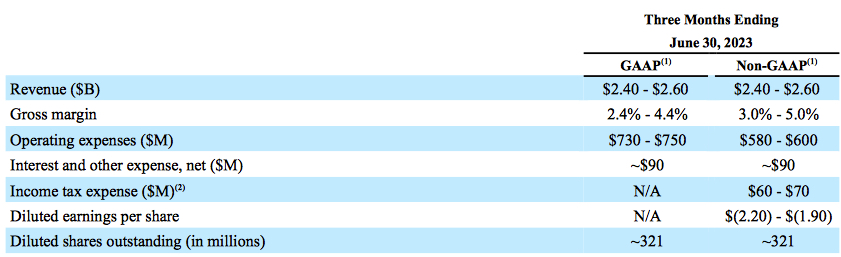
• Expect 4FQ23 revenue to be in the range of $2.40 billion to $2.60 billion.
• Expect Non-GAAP EPS in the range of $(2.20) to $(1.90) which includes $220 to $240 million of underutilization charges in flash and HDD.
Western Digital Corp. reported fiscal third quarter 2023 financial results.
“Over the last several years, our team has focused on enhancing business agility and delivering a range of innovative, industry-leading products that address the increasing storage demands of our customers,” said David Goeckeler, CEO. “The groundwork we laid, combined with the actions we have taken since the beginning of this fiscal year to right-size and refocus our businesses, have enabled us to navigate a dynamic environment. I am pleased that we delivered non-GAAP gross margin at the higher end of our guidance range due to strong execution across both our HDD and flash businesses.“
The company had an operating cash outflow of $381 million and ended the quarter with $2.22 billion of total cash and cash equivalents.
In 3FQ23:
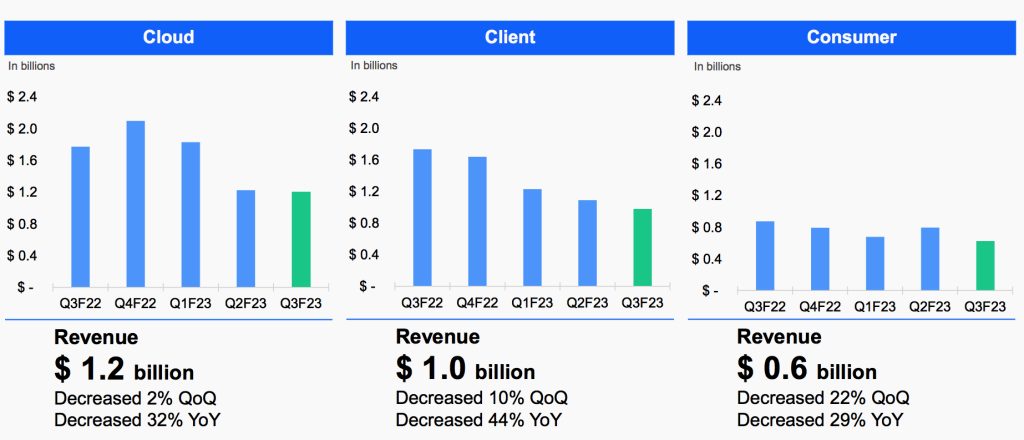
• Cloud represented 43% of total revenue. Sequentially, an increase in capacity enterprise drive shipments was offset by a decrease in flash shipments. The Y/Y decline was primarily due to a decline in shipments of both HDD and flash products, as well as price decreases in flash.
• Client represented 35% of total revenue. On both a sequential and Y/Y basis, the decrease was driven by price declines across our flash products and a lower client SSD and HDD shipments for PC applications.
• Consumer represented 22% of total revenue. Sequentially, the decrease was due to a seasonal decline in shipments of both retail HDD and flash products, as well as price declines in retail flash. The yearly decrease was driven by lower retail HDD shipments and price declines in flash.
Revenue trends by end market
Outlook for 4Q23
Comments
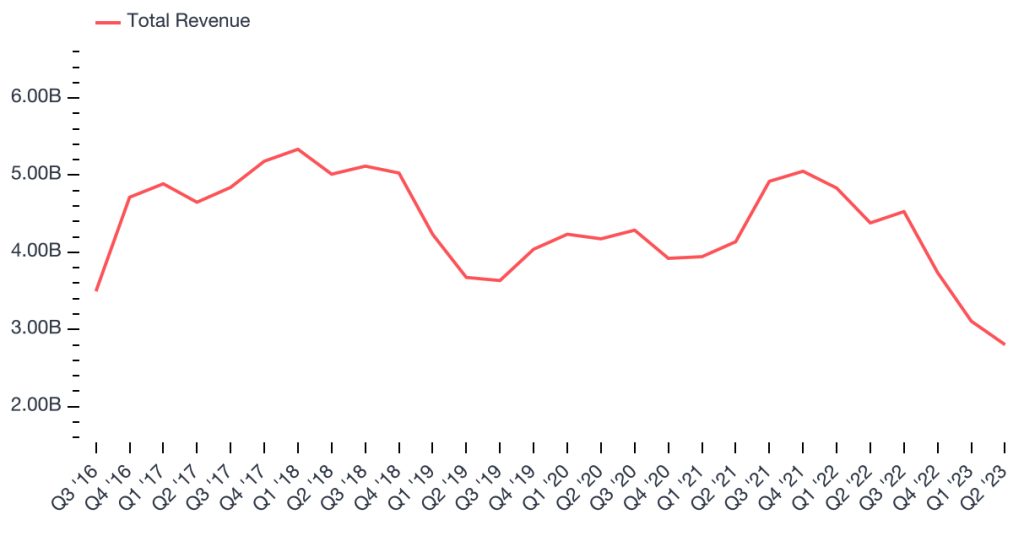
Total revenue for the quarter was $2.8 billion, down 10% Q/Q and 36% Y/Y, at the high end of the guidance range (between $2.60 and $2.80 billion).
Total revenue
For 3FQ23, total bit shipments increased 9% Q/Q to 115EB.
Flash
- Revenue was $1.3 billion, down 10% Q/Q and 42% Y/Y.
- Bit shipments decreased 14% Q/Q and 1% Y/Y to 21EB.
- ASP/GB decreased 10% Q/Q
- Gross margin was -5%, down 19.5 percentage points Q/Q and 40.6 percentage points Y/Y.
HDD
- Revenue was 1.5 billion, up 3% Q/Q and down 30% Y/Y.
- Total units was down 2% Q/Q to 12.6 million.
- Exabyte shipments increased 15% Q/Q to 93EB.
- ASP per drive up 10% Q/Q at $109.
- During the quarter, 22TB CMR drive became the highest-volume product among all of 20TB and above capacity points.
- WD expects to complete qualification of it 26TB UltraSMR technology in 4FQ23.
- Gross margin was higher than anticipated at 24.3%, up 3.6 percentage points sequentially and down 3.4 percentage points year over year. Sequentially, the increase was primarily due to higher capacity enterprise volume, as well as lower manufacturing costs and underutilization-related charges.
HDD and flash revenue
| in $ million | 1FQ21 | 2FQ21 | 3FQ21 |
4FQ21 |
1FQ22 |
2FQ22 |
3FQ22 |
4FQ22 |
1FQ23 | 2FQ23 | 3FQ23 |
2FQ23/3FQ23 growth |
| HDDs |
1,844 | 1,909 | 1,962 | 2,501 | 2,561 | 2,213 | 2,138 | 2,128 | 2,014 | 1,657 | 1,496 | -10% |
| Flash |
2,078 | 2,034 | 2,175 | 2,419 | 2,490 | 2,620 | 2,243 | 2,400 | 1,722 | 1,450 | 1,307 | -10% |
By business, and HDD
| Client revenue (1) |
Cloud revenue (1) |
Consumer revenue (1) |
Total HDDs (2) |
HDD ASP |
|
| 1FQ21 |
1,750 | 1,291 | 881 | 23.0 |
$79 |
| 2FQ21 |
1,869 | 1,014 | 1,060 | 25.7 |
$73 |
| 3FQ21 |
1,767 | 1,423 | 947 | 23.2 |
$82 |
| 4FQ21 |
1,895 | 1,995 | 1,030 | 25.4 |
$97 |
| 1FQ22 |
1,853 | 2,225 | 973 | 24.1 |
$102 |
| 2FQ22 |
1,854 | 1,920 | 1,059 | 21.6 |
$97 |
| 3FQ22 |
1,732 | 1,774 | 875 | 19.8 |
$101 |
| 4FQ22 |
1,637 | 2,098 | 793 | 16.5 |
$120 |
| 1FQ23 |
1,229 | 1,829 | 678 | 14.7 | $125 |
| 2FQ23 |
1,089 | 1,224 | 794 | 12.9 | $99 |
| 3FQ23 |
975 | 1,205 | 623 | 12.6 | $109 |
Outlook
- Revenue of $2,400 to $2,600 million or -14% to -7% for 4FQ23, corresponding to $12,046 million to 12,246 million or -32% to -35% for FY23.
- The company expects HDD revenue to decrease sequentially due to ongoing inventory digestion at cloud customers. It expects flash revenue to decrease sequentially as modest growth in bit shipments is more than offset by ASP declines. It expects flash bit shipment growth to accelerate in 1FH24. In 4FQ23, total gross margin will be negatively impacted by underutilization charges and flash pricing.


 Subscribe to our free daily newsletter


