


 Western Digital: Fiscal 4Q21 Financial Results
Q/Q revenue up 11% for flash and 27% for HDDs
This is a Press Release edited by StorageNewsletter.com on August 5, 2021 at 1:32 pm| (in $ million) | 4Q20 | 4Q21 | FY20 | FY21 |
| Revenue | 4,287 | 4,920 | 16,736 | 16,922 |
| Growth | 15% | 1% | ||
| Net income (loss) | 369 | 680 | 914 | 1,406 |
Western Digital Corp. reported fourth quarter and fiscal year 2021 financial results.
“I am extremely proud of the outstanding execution our team exhibited as we achieved another quarter of strong revenue, gross margin and EPS results above expectations,” said David Goeckeler, CEO. “Throughout this fiscal year, we successfully delivered both flash and HDD innovations that are essential building blocks in the acceleration of the data economy. This innovation, combined with our broad channels to market, diverse end market exposure and improved operational efficiency, enabled us to successfully navigate through the pandemic and capitalize on strategic growth opportunities. We believe we have the right foundation for success – the right products, the right customer base, and the unique ability to address 2 very large and growing markets.”
In 4FQ21, revenue increased 19% Q/Q and 15% Y/Y to $4.9 billion. The company’s improving execution and ability to shift bits across broad routes to diverse markets enabled growth in revenue and gross margin and drove strong free cash flow.
Client Devices experienced broad-based strength across nearly every product category on a sequential basis. Contributing to this momentum was better than expected demand for notebook and desktop HDDs, as well as flash-based solutions. In addition, there was robust demand for gaming, smart video, automotive, and industrial applications.
Data Center Devices & Solutions achieved a record shipment of over 104EB in capacity enterprise HDDs, highlighting the importance of these products to datacenter customers. The 18TB energy-assisted HDD was the leading capacity point and comprised nearly half of capacity enterprise shipments. Enterprise SSD demand strengthened as the company completed a qualification at another cloud titan and is now ramping the product more broadly.
Client Solutions experienced greater than seasonal demand resulting in sequential growth for both HDD and flash-based solutions. Despite the uneven reopening of economies around the world, the company was able to drive growth in both revenue and gross margin due to the breadth of its portfolio and many routes to market.
Comments
In this most recent quarter, revenue increased 19% Q/Q and 15% Y/Y to $4.9 billion, non-GAAP gross margin of 33% and non-GAAP earnings per share of $2.16, all above the guidance ranges provided last April.
But in late trading, stock is off 0.7%, at $64.51.
At the end of the quarter, WDC had $3.4 billion in cash and cash equivalents.
Revenue trends
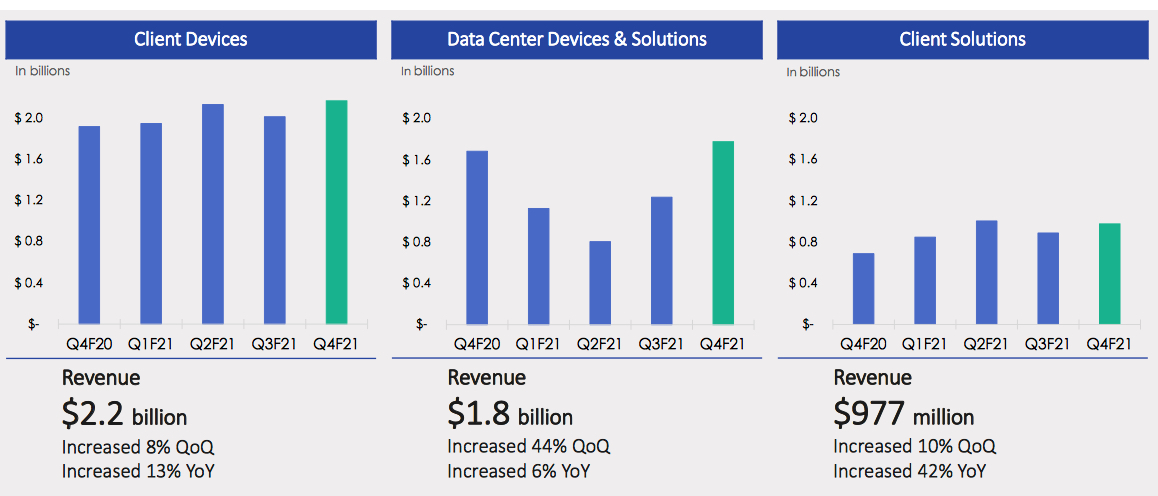
Client Devices
Revenue was $2.2 billion, up 8% Q/Q and up 13% Y/Y. On a sequential basis, the company experienced revenue growth in both hard drives and flash and across every major product categories: client HDDs, client SSDs, automotive, gaming, smart video and industrial. Mobile revenue was flat on a sequential basis.
Data Center Devices and Solutions
Sales were $1.8 billion, up 44% Q/Q and up 6% Y/Y. New product ramps in this end market drove more than double the revenue growth from 2 quarters ago.
Client Solutions
Revenue was $977 million, up 10% Q/Q and up 42% Y/Y. Once again revenue growth was broad based across both HDD and flash and all major product categories.
Flash
- Drove revenue and gross margin growth in the face of component and NAND shortages by continuing to shift bits to meet customer needs.
- Achieved strong Q/Q sales growth in data center devices and solutions due to stronger than expected demand for NVMe enterprise SSDs.
- Demand for latest gen of game consoles and WD-Black product line remained robust.
- Bit shipments increased 4% Q/Q to around 29EB..
- ASP/GB: blended increased 7% Q/Q, like-for-like up 4% Q/Q.
HDDs
- Revenue at $2.5 billion, up 28% Q/Q and up 22% Y/Y.
- Shipments up 9% Q/Q to 25.4 million.
- Ramp of 18TB energy-assisted unit was primary contributor to highest organic sequential revenue growth experienced in last decade, shipments nearly tripled sequentially, driven by growing cloud demand, a recovery in enterprise spending, and to a lesser extent crypto currency driven by Chia. There was increased demand for HDDs due to proof-of-space crypto currencies such as Chia, which emerged as a new vertical market at the beginning of the quarter. The manufacturer believes this proof-of-space crypto currency presents a great opportunity in the industry, but is closely monitoring the sustainability of demand.
- Record shipments of 105EB in capacity enterprise devices, a 40% sequential increase.
- Retail demand better than expected, supported by continued work-from-home, distance learning and at-home entertainment trends.
- Total exabyte shipments increased 34% Q/Q to around 166.2EB.
- ASP from $82 in 3FQ21 to $97 in 4FQ21, up 18%.
- Gross margin was 30.3% up 5.3 percentage points sequentially. This also includes a Covid-related impact of $32 million or approximately $1.3 percentage points.
Outlook
- 1FQ22 revenue in the range of $4.90 billion to $5.10 billion (-0% to 4% Q/Q) with non-
GAAP EPS in the range of $2.25 to $2.55. - Gross margin between 33% and 35%.
- HDD gross margin relatively flat and flash gross margin to improve sequentially.
HDD and flash revenue
| in $ million | 1FQ18 | 1FQ19 | 2FQ19 |
3FQ19 |
4FQ19 |
1FQ20 |
2FQ20 |
3FQ20 |
4FQ20 |
1FQ21 | 2FQ21 | 3FQ21 |
4FQ21 |
3FQ21 /4FQ21 growth |
| HDDs |
2,610 | 2,494 | 2,060 | 2,064 | 2,128 | 2,408 | 2,396 | 2,114 | 2,049 | 1,844 | 1,909 | 1,962 | 2,501 | 27% |
| Flash |
2,571 | 2,534 | 2,173 | 1,610 | 1,506 | 1,632 | 1,838 | 2,061 |
2,238 | 2,078 | 2,034 | 2,175 | 2,419 | 11% |
Volume and HDD Share
(units in million)
| Client compute units (5) |
Non-compute units (6) |
Data centers units (7) |
Total HDDs (8) |
ASP (9) |
|
| 1FQ19 | 16.3 | 11.2 | 6.6 | 34.1 | $72 |
| 2FQ19 |
14.0 | 11.3 | 5.1 | 30.2 |
$67 |
| 3FQ19 |
12.9 | 9.3 | 5.6 | 27.8 | $73 |
| 4FQ19 |
12.3 | 9.2 | 6.2 | 27.7 | $75 |
| 1FQ20 |
12.9 | 8.9 | 7.5 | 29.3 | $81 |
| 2FQ20 |
11.8 | 10.3 | 7.1 | 29.2 | $81 |
| 3FQ20 |
9.1 | 8.0 | 7.3 | 24.4 |
$85 |
| 4FQ20 |
9.4 | 6.9 | 6.8 | 23.1 |
$87 |
| 1FQ21 |
9.3 | 8.2 | 5.5 | 23.0 |
$79 |
| 2FQ21 |
10.7 | 10.1 | 4.9 | 25.7 |
$73 |
| 3FQ21 |
9.2 | 8.3 | 5.7 | 23.2 |
$82 |
| 4FQ21 |
9.0 | 8.7 | 7.7 | 25.4 |
$97 |
(6) Non-compute products consist of retail channel and consumer electronics HDDs
(7) Data center products consist of enterprise HDDs (high-capacity and performance) and enterprise systems
(8) HDD unit volume excludes data storage systems and media
(9) HDD ASP is calculated by dividing HDD revenue by HDD units. Data storage systems are excluded from this calculation, as data storage systems ASP is measured on a per system basis rather than a per drive basis
Seagate vs. WD for 4FQ21
(in $ million, but ASP in $)
| Seagate | WD | % in favor of WD |
|
| Revenue | 3,013 | 4,920 | +63% |
| Net income | 482 | 680 | +41% |
| HDD revenue |
2,737 | 2,501 | -9% |
| SSD revenue |
276 | 2,419 | x9 |
| HDD ASP | 97 | 97 | 0% |


 Subscribe to our free daily newsletter


