


 Western Digital: Fiscal 3Q21 Financial Results
Flat revenue, sales of flash up 7% and HDD 3% Q/Q
This is a Press Release edited by StorageNewsletter.com on April 30, 2021 at 2:33 pm| (in $ million) | 3Q20 | 3Q21 | 9 mo. 20 | 9 mo. 21 |
| Revenue | 4,175 | 4,137 | 12,449 | 12,002 |
| Growth | -1% | -4% | ||
| Net income (loss) | 17 | 197 | (398) | 199 |
Western Digital Corp. reported fiscal third quarter 2021 financial results.
“We reported solid results above the guidance range, driven by increasing momentum of our energy-assisted drives and our second-gen NVMe enterprise SSDs, improving NAND flash pricing trends, along with the continued accelerated digital transformation across end markets,” said David Goeckeler, CEO. “Western Digital’s strengths in technology and cost leadership, expansive product portfolio and broad routes to market are providing a foundation upon which we are solidifying our position as an essential building block of the digital economy. These strengths, combined with our increased operational and strategic focus enabled by our new business unit structure, are driving results. As we continue to face a dynamic environment, we are seeing the benefits of the synergistic value in the breadth of Western Digital’s portfolio, and our unique ability to deliver both HDD and flash solutions to our diverse end-markets and customer base.“
The company generated $116 million in cash flow from operations, made a total debt repayment of $212 million, and ended the quarter with $2.7 billion of total cash and cash equivalents. There were 313 million ordinary shares outstanding at the end of the quarter.
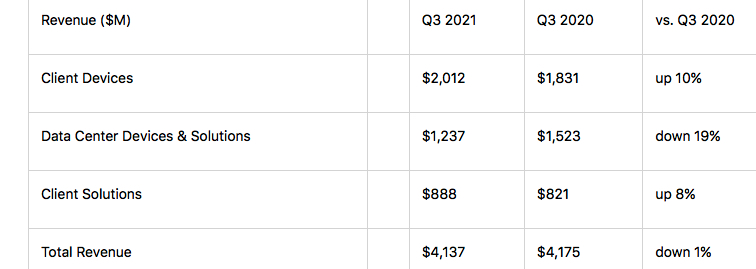
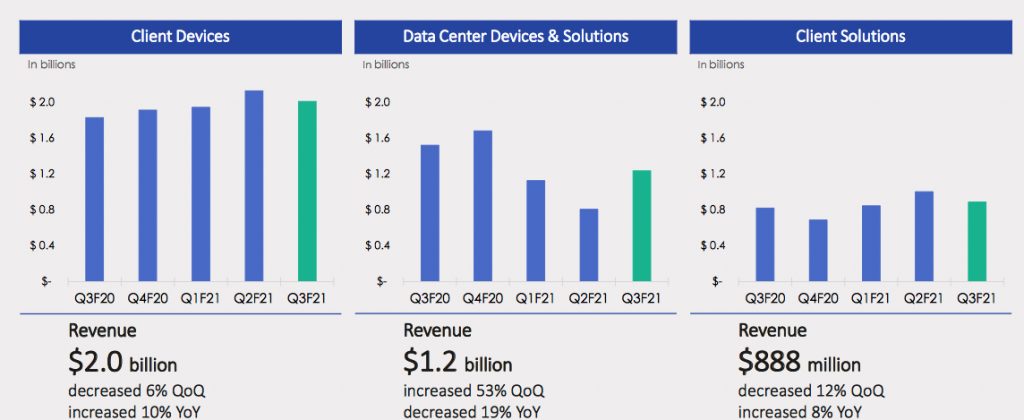
$4.1 billion, driven by a decline in data center devices and solutions offset by strong performance in gaming and consumer markets.
In client devices, continued strength in notebook and desktop PC demand, along with new game console ramps, drove revenue growth.
In data center devices and solutions, while revenue was down 19% from the prior year, the company experienced significant sequential growth with its second gen, NVMe enterprise SSD at a cloud titan. In addition, many cloud customers also utilize NAND flash for their consumer product lines, creating additional end market opportunities as the firm continues to diversify and balance the end markets served. Qualifications of energy-assisted HDDs have also been completed with nearly all cloud and enterprise customers, including all cloud titans.
In client solutions, revenue increased due to strength in retail, which remains a high performing end market, as Western Digital’s brand recognition, broad product portfolio, and extensive distribution channels continue to distinguish the company from its competitors.
Business outlook for 4FQ21: revenue between $4.4 and $4.6 billion
Comments
3FQ21 revenue was $4.1 billion, down 1% Y/Y and up 5% Q/Q, above guidance range ($3.85 billion to $4.05 billion), non-GAAP gross margin of 27.7% and non-GAAP earnings per share of $1.02.
Shares climb 7% after these results were revealed.
Key end market summary
Revenue trends
Flash and HDD metrics
Flash
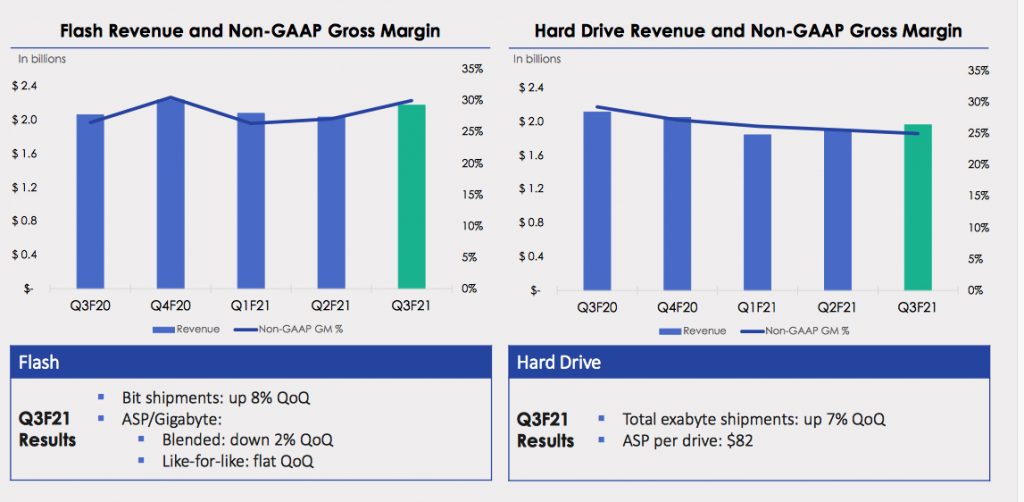
- Flash revenue was $2.2 billion, up 7% Q/Q and up 6% Y/Y.
- ASPs were down 2% sequentially on a blended basis and flat on a like-for-like basis.
- Flash bit shipments increased 8% sequentially.
- Significant growth with second gen NVMe enterprise SSD at a cloud titan
- WD Black products maintained strong level of interest as gamers have gravidated toward more customized solutions.
- Announced BiCS6n next gen flash device based on 162-layer and CUA technology.
- Improving pricing trends in the retail and transactional portions of the market are translating to better pricing in a negotiated portions of the market, and WDC expects this trend to continue in 4FQ21
HDD
- Revenue was $2 billion, up 3% Q/Q and down 7% Y/Y.
- On a sequential basis, total HDD exabyte shipments increased by 7%, while the average price per hard drive increased 14% to $82.
- Total HDD units were down 10% Q/Q to 23.2 million devices.
- Revenue growth was led by capacity enterprise drives.
- Complete qualification for energy-assisted drives with nearly all cloud and enterprise customers, including all cloud titans
- Enter into longer-term agreements for 18TB drives with a number of cloud titans
- Retail HDD demand better than expected, supported by continued work-from-home, distance learning, and at-home entertainment trends
Data center devices and solutions
- Revenue was $1.2 billion, up 53% Q/Q, but down 19% Y/Y. Sales from both capacity enterprise hard drives and SSDs grew sequentially.
- The sequential growth was driven by new energy-assisted hard drives at the 16TB and 18TB capacity points and second-generation NVMe enterprise SSD products, both targeted for the cloud and large-scale enterprise OEMs.
- The firm reported significant growth in the quarter with its second-gen NVMe enterprise SSD in a cloud titan. In addition, many cloud customers also utilize NAND flash for their consumer product lines. WDC is achieving significant progress in VR headsets, game consoles and other at-home entertainment devices where it experienced over 10x bit growth last calendar year and expects to double again this calendar year.
Client devices
- Revenue was $888 million, down 12% Q/Q and up 8% Y/Y.
- There was a continued strength in PC demand, along with the new game console ramps drove sequential revenue growth above typical seasonal trends.
- Retail remained a high-performing end market as firm's brand recognition, product portfolio and distribution channels continue to distinguish from competitors. In particular, it was a solid quarter for gaming with WD Black product line having maintained strong levels of interest as gamers have gravitated towards more customized solutions.
Business outlook for 4FQ21:
- Revenue up between 6% and 11% from 3FQ21
- Both HDD and flash revenue to be up sequentially. It also expects gross margin to be between 30% and 32%, and both flash and HDD gross margin to improve sequentially.
HDD and flash revenue
| in $ million | 1FQ18 | 1FQ19 | 2FQ19 |
3FQ19 |
4FQ19 |
1FQ20 |
2FQ20 |
3FQ20 |
4FQ20 |
1FQ21 | 2FQ21 | 3FQ21 |
2FQ21 /3FQ21 growth |
| HDD |
2,610 | 2,494 | 2,060 | 2,064 | 2,128 | 2,408 | 2,396 | 2,114 | 2,049 | 1,844 | 1,909 | 1,962 | 3% |
| Flash |
2,571 | 2,534 | 2,173 | 1,610 | 1,506 | 1,632 | 1,838 | 2,061 |
2,238 | 2,078 | 2,034 | 2,175 | 7% |
Volume and HDD Share
(units in million)
| Client compute units (5) |
Non-compute units (6) |
Data centers units (7) |
Total HDDs (8) |
ASP (9) |
|
| 1FQ19 | 16.3 | 11.2 | 6.6 | 34.1 | $72 |
| 2FQ19 |
14.0 | 11.3 | 5.1 | 30.2 |
$67 |
| 3FQ19 |
12.9 | 9.3 | 5.6 | 27.8 | $73 |
| 4FQ19 |
12.3 | 9.2 | 6.2 | 27.7 | $75 |
| 1FQ20 |
12.9 | 8.9 | 7.5 | 29.3 | $81 |
| 2FQ20 |
11.8 | 10.3 | 7.1 | 29.2 | $81 |
| 3FQ20 |
9.1 | 8.0 | 7.3 | 24.4 |
$85 |
| 4FQ20 |
9.4 | 6.9 | 6.8 | 23.1 |
$87 |
| 1FQ21 |
9.3 | 8.2 | 5.5 | 23.0 |
$79 |
| 2FQ21 |
10.7 | 10.1 | 4.9 | 25.7 |
$73 |
| 3FQ21 |
9.2 | 8.3 | 5.7 | 23.2 |
$82 |
(6) Non-compute products consist of retail channel and consumer electronics HDDs
(7) Data center products consist of enterprise HDDs (high-capacity and performance) and enterprise systems
(8) HDD unit volume excludes data storage systems and media
(9) HDD ASP is calculated by dividing HDD revenue by HDD units. Data storage systems are excluded from this calculation, as data storage systems ASP is measured on a per system basis rather than a per drive basis
Seagate vs. WD for 3FQ21
(in $ million, but ASP in $)
| Seagate | WD | % in favor of WD |
|
| Revenue | 2,731 | 4,137 | +51% |
| Net income | 329 | 197 | -41% |
| HDD revenue |
2,493 | 1,962 | -21% |
| SSD revenue |
238 | 2,175 | x9 |
| HDD ASP | 91 | 82 | -10% |


 Subscribe to our free daily newsletter


