


Western Digital: Fiscal 4Q20 Financial Results Results
Bad outlook after excellent quarter, more on flash than HDD
This is a Press Release edited by StorageNewsletter.com on August 7, 2020 at 2:12 pm| (in $ million) | 4Q19 | 4Q20 | FY19 | FY20 |
| Revenue | 3,634 | 4,287 | 16,569 | 16,736 |
| Growth | 18% | 1% | ||
| Net income (loss) | (197) | 148 | (754) | (250) |
Summary
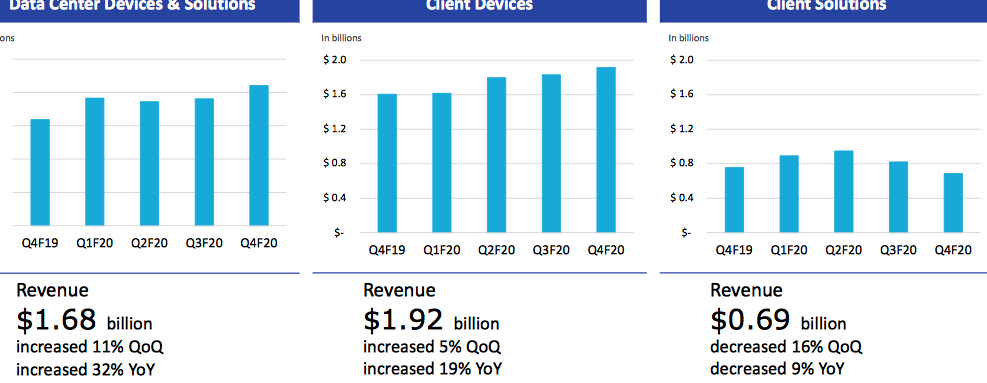
• 4Q20 revenue was $4.3 billion, up 18% Y/Y (Y/Y). Data Center Devices and Solutions revenue grew 32%, Client Devices grew 19%, and Client Solutions declined 9% Y/Y. Fiscal year 2020 revenue was $16.7 billion, up 1.0% Y/Y.
• 4Q20 GAAP earnings-per-share (EPS) was $0.49 and non-GAAP EPS was $1.23. Both GAAP and non-GAAP EPS include $96 million in costs related to Covid-19 in the fourth quarter. Fiscal year 2020 GAAP EPS was ($0.84) and non-GAAP EPS was $3.04.
• Generated operating cash flow of $172 million and free cash flow of $261 million in 4Q20. Generated operating cash flow of $824 million and free cash flow of $1.1 billion in FY20.
• Expecting 1FQ21 revenue to be in the range of $3.7 to $3.9 billion with non-GAAP EPS in the range of $0.45 to $0.65. Non-GAAP EPS outlook includes costs related to Covid-19.
Western Digital Corp. reported fourth quarter and fiscal year 2020 financial results.
“I am extremely proud of the way our team has navigated the complexities and uncertainties inherent in this unprecedented environment, as we continue to adapt to provide supply continuity and high-quality products to our customers and drive value for our shareholders,” said CEO David Goeckeler. “While we continue to navigate through a dynamic environment, we remain focused on managing the business for the long-term, including ramping two important product lines to high volume: our SSD products and our energy-assisted capacity enterprise drives. We will continue to deliver the quality, performance and cost-effectiveness our customers rely on, and I am confident that our end market diversity and breadth, broad customer base, channel reach, and innovative leadership all position Western Digital to benefit from the multi-year growth in data creation and storage.“
In 4Q20, revenue increased 18% Y/Y to $4.3 billion, led by strength within Data Center Devices & Solutions and Client Devices end markets.
In Client Devices, family of client SSDs, which are suited for remote learning and work from home applications, achieved another record quarter of revenue. Notebook and desktop-related HDD revenue declined slightly sequentially as the market continued to transition to SSD-based products. Smart video was weaker than expected due to continued headwinds associated with the pandemic. In gaming, the firm began shipping flash solutions for the upcoming new game console launches.
In Data Center Devices & Solutions, cloud demand increased in 4Q20 due to the work from home trend. The firm was the first in the industry to ship energy-assisted drives for mass production and the company expects a strong ramp into the second fiscal quarter and beyond. In addition, its flash-based enterprise SSDs more than doubled in revenue from a year ago.
In Client Solutions, while the company has a robust distribution channel with over 350,000 points of purchase around the world and well-established brands, it was impacted by Covid-related lockdowns at many brick-and-mortar customers. This business recovered as the quarter progressed due to easing of lockdowns and a transition to online buying with curbside pickup.
Outlook for 1FQ21: revenue $3.7 to $3.9 billion
Comments
Revenue was $4,287 billion for 4Q20, +3% Q/Q and (+18.5% Y/Y)
Results corresponds to low guidance, as, for the former quarter, the company was expecting sales in 4FQ20 in the range of $4.25 to $4.45 billion.
It is back to profit Y/Y but continues to be profitable Q/Q.
But Western Digital shares were down 12% following 4FQ21 revenue relatively miss and downside guidance.
Revenue trends
Flash and HDD metrics
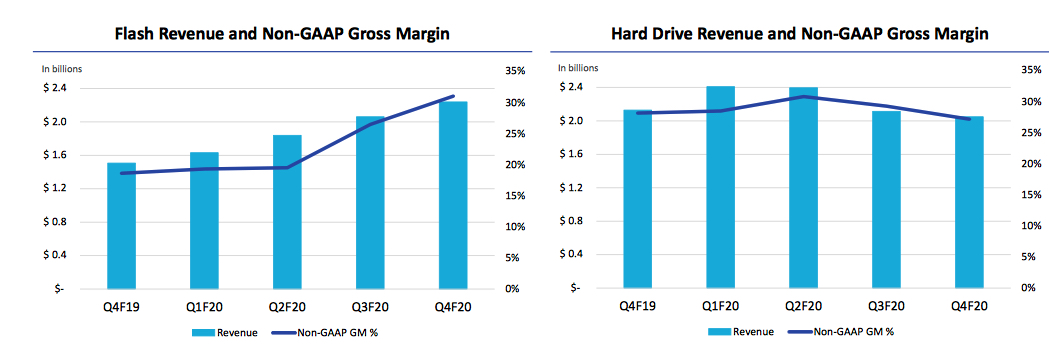
The major item that impacted gross margin was Covid-19 related costs of $96 million. This almost exclusively impacted HDD business and was primarily related to reduced factory utilization and higher logistics costs.
Flash business
4GQ20 was another quarter of record client SSD revenue.
Enterprise SSD revenue increased almost 70% sequentially and revenue share increased to the low double digits.
Bit shipments were up 8% and ASP/GB was up 1% sequentially.
Flash revenue was $2.2 billion, up 9% Q/Q and up 49% Y/Y. Flash ASPs were up 1% sequentially on a blended basis and up 3% on a like-for-like basis. Bit shipments were up 8% sequentially.
Healthy demand for our flash-based notebook solutions drove record revenue in OEM end market. In retail, while the firm has a robust distribution channel with over 350,000 points of purchase around the world in well-established brands, it was impacted by COVID-related lockdowns at many of its brick-and-mortar customers. The firm did see the business recover as the quarter progressed due to easing of lockdowns and the transition to online buying with curbside pickup.
The company sees an expanding TAM for flash that underpins a multiyear growth opportunity.
It launched BiCS5, 112-layer flash product in retail last quarter, which delivers capacity, performance and reliability, at an attractive cost. The ramp has gone very well with excellent yields and the company is just at the beginning stages of this product ramp. While it focusses on ramping BiCS5, BiCS4 has continued to provide a good balance of performance and cost reduction. BiCS4 represented over 60% of bits shipped in the quarter.
Earlier this year, WDC celebrated the first production wafer shipment from its K1 fab, a new manufacturing facility for 3D BiCS flash memory in partnership with Kioxia.
Hard Drives
Revenue was $2.1 billion, down 3% Q/Q and 4% Y/Y. Total exabyte shipments were down 2%. On a sequential basis, the average price per HDD increased 2% to $87 as mix continued to shift to the cloud.
Customer interest in 16TB and 18TB devices is high. The firm expects a strong ramp in 2FQ21. Demand for 14TB drives continues to be strong.
Capacity enterprise exabyte shipment grew 30% from the prior year
At the end of the quarter, WDC has $3 billion in cash and cash equivalents.
Revenue is expected to be only $3.7 to $3.9 billion or between -14% and -9%.
In the near term, it expects to remain challenged by the pandemic in the global economic contraction.
Growth in Client Solutions in 1FQ21 is expected to be more than offset by a decline in both Data Center Devices and Solutions and Client Devices.
HDD and flash revenue
| in $ million | 1FQ18 | 1FQ19 | 2FQ19 |
3FQ19 |
4FQ19 |
1FQ20 |
2FQ20 |
3FQ20 |
4FQ20 |
3Q20/4Q20 growth |
| HDD |
2,610 | 2,494 | 2,060 | 2,064 | 2,128 | 2,408 | 2,396 | 2,114 | 2,049 | -3% |
| Flash |
2,571 | 2,534 | 2,173 | 1,610 | 1,506 | 1,632 | 1,838 | 2,061 |
2,238 | 9% |
Exabyte metrics
| 1FQ19 | 2FQ19 | 3FQ19 | 4FQ19 |
1FQ20 |
2FQ20 |
3FQ20 |
4FQ20 |
|
| Q/Q change in HDD exabytes sold (1) | -6% | -17% | 13% | 14% | 23% | -1% | -6% | -2% |
| Q/Q change in flash exabytes sold (1) | 28% | 5% | -5% | -1% | 9% | 24% | 7% | 8% |
| Q/Q change in total exabytes sold (1) | -3% | -15% | 11% | 12% | 22% | 1% | -5% | -1% |
| Flash metrics | 1FQ19 | 2FQ19 | 3FQ19 | 4FQ19 |
1FQ20 |
2FQ20 |
3FQ20 |
4FQ20 |
| Q/Q change in ASP/GB (1) | -16% | -18% | -23% | -6% | 0% | -8% | 5% | 1% |
(1) Excludes licensing, royalties, and non-memory products.
Volume and HDD Share
(units in million)
| Client compute units (5) |
Non-compute units (6) |
Data centers units (7) |
Total HDDs (8) |
Exabytes Shipped |
ASP (9) |
|
| 2FQ18 |
21.1 | 14.4 | 6.8 | 42.3 |
NA | $63 |
| 3FQ18 |
17.6 | 11.2 | 7.6 | 36.4 |
NA | $72 |
| 4FQ18 |
17.8 | 13.7 | 7.5 | 39.0 |
NA | $70 |
| 1FQ19 | 16.3 | 11.2 | 6.6 | 34.1 | 103.3 | $72 |
| 2FQ19 |
14.0 | 11.3 | 5.1 | 30.2 |
75.9 |
$67 |
| 3FQ19 |
12.9 | 9.3 | 5.6 | 27.8 | 97.5 | $73 |
| 4FQ19 |
12.3 | 9.2 | 6.2 | 27.7 | 111.5 | $75 |
| 1FQ20 |
12.9 | 8.9 | 7.5 | 29.3 | 131 | $81 |
| 2FQ20 |
11.8 | 10.3 | 7.1 | 29.2 | 133.6 | $81 |
| 3FQ20 |
9.1 | 8.0 | 7.3 | 24.4 |
126.6 | $85 |
| 4FQ20 |
9.4 | 6.9 | 6.8 | 23.1 |
NA | $87 |
(6) Non-compute products consist of retail channel and consumer electronics HDDs
(7) Data center products consist of enterprise HDDs (high-capacity and performance) and enterprise systems
(8) HDD unit volume excludes data storage systems and media
(9) HDD ASP is calculated by dividing HDD revenue by HDD units. Data storage systems are excluded from this calculation, as data storage systems ASP is measured on a per system basis rather than a per drive basis
Seagate vs. WD for 4FQ20
(revenue and net income in $ million, units in million)
| Seagate | WD | % in favor of WD |
|
| Revenue | 2,517 | 4,287 | 70% |
| Net income | 166 | 148 | -11% |
| HDD shipped | 32.4 | 23.1 | -29% |
| Average GB/drive | 4,500 | 4,692 | 4% |
| Exabytes shipped (HDD) |
117.0 | 108.4 | -8% |
| HDD ASP | $89 | $87 | -2% |


 Subscribe to our free daily newsletter


