


 Western Digital: Fiscal 2Q21 Financial Results
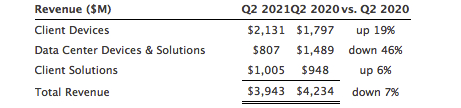
Revenue down 7% Y/Y, largely attributable to data center devices and solutions (-46%)
This is a Press Release edited by StorageNewsletter.com on February 1, 2021 at 2:42 pm| (in $ million) | 2Q20 | 2Q21 | 6 mo. 20 | 6 mo. 21 |
| Revenue | 4,234 | 3,943 | 8,274 | 7,865 |
| Growth | -7% | -5% | ||
| Net income (loss) | (139) | 62 | (415) | 2 |
Western Digital Corp. reported fiscal second quarter 2021 financial results.
“The team delivered solid results this quarter, especially as we continue adapting our business and technology portfolio to take advantage of the immense opportunities in the storage industry,” said David Goeckeler, CEO. “During the quarter, we captured strength in the retail business and also delivered on our target outcome to complete qualification of our energy-assisted HDDs and second-gen enterprise SSD products with some of the world’s largest data center operators. While there is still more work to be done, we remain extremely focused on meeting the needs of our customers and ramping our next-gen products throughout calendar 2021.”
In 2FQ21, Western Digital’s revenue decreased 7% Y/Y to $3.9 billion. The decrease is largely attributable to a decline in data center devices and solutions end market, more than offsetting growth in client devices and client solutions.
In client devices, NVMe-based client SSDs and relationships with major PC OEMs drove a record level of exabyte shipments.
The pandemic has not only accelerated the digital transformation, but it has also spurred technological innovation, driving the ability to access the cloud using powerful and advanced end-devices. The ability to access, store, and share data from anywhere, on any device, has resulted in robust storage demand for notebook, tablet, and Chromebook devices.
In data center devices and solutions, qualifications of the second-gen eSSD products have progressed well, with nearly 150 qualifications completed, including at one cloud titan.
There has been solid progress made completing the qualifications of energy-assisted HDDs, including at 3 of the 4 US cloud titans. While one now-completed cloud titan qualification slipped beyond anticipated timeline in 2FQ21, another cloud titan qualification was completed, ahead of schedule.
With cloud digestion abating and the stabilization of OEM demand, the firm believes the demand in capacity enterprise bottomed in 2FQ21 and are anticipating a rebound in 3FQ21.
In client solutions, revenue increased during the seasonally strong quarter, to a 2-year high. This performance was driven by continued growth in retail, supported by the strength of brand and the breadth of portfolio.
Comments
For the quarter, revenue at $3,943 million is at the top of the guidance ($3,950 million), down 7% Y/Y and 1% Q/Q.
Stock rose more than 10% after the company reports these results.
Growth in client devices and client solutions was mostly offset by a decline in data center devices and solutions end market.
Client Devices
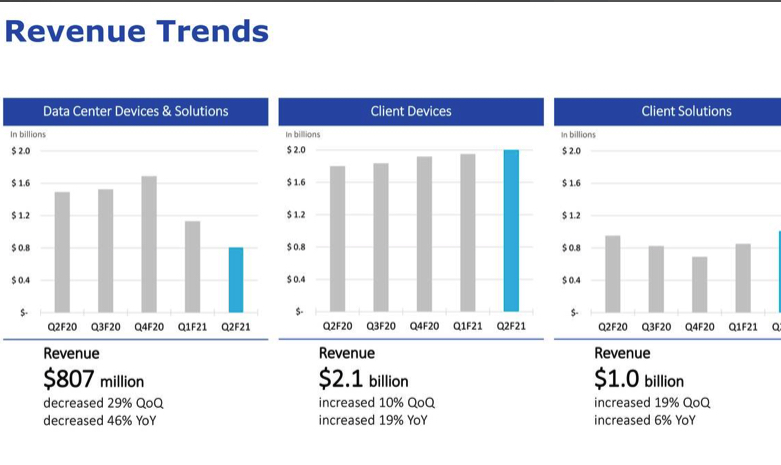
- Revenue was $2.1 billion, up 10% Q/Q and 19% Y/Y. Work, school and game from home trends continue to drive demand for our flash and HDD solutions for notebook and desktop applications.
- In notebook and desktop, flash and HDD sales each grew over 20% Q/Q.
- Demand for smart video HDD was stronger than expected, growing 30% Q/Q as demand continued to recover from the bottom set in 4FQ20 during the height of the Covid-related lockdowns.
- Mobile revenue was down sequentially, with growth in recently introduced 5G phones offset by dynamics within China.
Data Center Devices and Solutions
Revenue was $807 million, down 29% Q/Q and 46% Y/Y. Sales from both capacity enterprise HDDs and enterprise SSDs were down Q/Q, as the manufacturer had an unexpected delay in a qualification at a cloud titan. As a result, during the quarter, capacity enterprise drive shipments were negatively impacted and inventory grew. But WD have since completed this qualification.
Client Solutions
Revenue was above expectations at $1 billion, up 19% Q/Q and 6% Y/Y. The work, school and gaming from home trend benefited both HDD and flash-based products, highlighting the powerful go-to-market synergies of this channel.
Flash
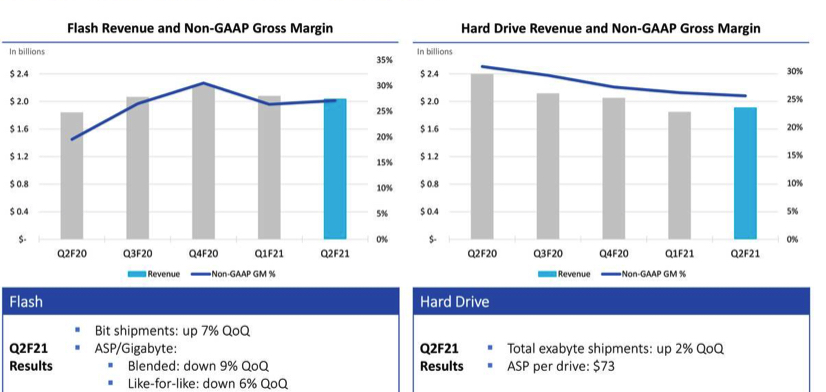
- Revenue was $2 billion down 2% Q/Q and up 11% Y/Y. ASPs were down 9% Q/Q on a blended basis and down 6% on a like-for-like basis. Bit shipments were up 7% Q/Q.
- The firm began shipping 112 layer BiCS5 technology and client SSD products in most recent quarter.
HDD
- Revenue was $1.9 billion, up 4% Q/Q and down 20% Y/Y.
- On a sequential basis, total exabyte shipments were up 2%, while the average price per HDD decreased 8% to $73.
- Upside demand in PC, notebook and smart video more than offset weakness in capacity enterprise.
- Smart video business continues to recover, growing 30% Q/Q.
- With cloud digestion abating and the stabilization of OEM demand, WDC believes the demand in capacity enterprise bottomed in 2FQ21 and are anticipating a rebound in 3FQ21.
- 18TB is expected to be firm's leading capacity point.
HDD and flash revenue
| in $ million | 1FQ18 | 1FQ19 | 2FQ19 |
3FQ19 |
4FQ19 |
1FQ20 |
2FQ20 |
3FQ20 |
4FQ20 |
1FQ21 | 2FQ21 | 1Q21 /2FQ21 growth |
| HDD |
2,610 | 2,494 | 2,060 | 2,064 | 2,128 | 2,408 | 2,396 | 2,114 | 2,049 | 1,844 | 1,909 | +4% |
| Flash |
2,571 | 2,534 | 2,173 | 1,610 | 1,506 | 1,632 | 1,838 | 2,061 |
2,238 | 2,078 | 2,034 | -2% |
Volume and HDD Share
(units in million)
| Client compute units (5) |
Non-compute units (6) |
Data centers units (7) |
Total HDDs (8) |
ASP (9) |
|
| 1FQ19 | 16.3 | 11.2 | 6.6 | 34.1 | $72 |
| 2FQ19 |
14.0 | 11.3 | 5.1 | 30.2 |
$67 |
| 3FQ19 |
12.9 | 9.3 | 5.6 | 27.8 | $73 |
| 4FQ19 |
12.3 | 9.2 | 6.2 | 27.7 | $75 |
| 1FQ20 |
12.9 | 8.9 | 7.5 | 29.3 | $81 |
| 2FQ20 |
11.8 | 10.3 | 7.1 | 29.2 | $81 |
| 3FQ20 |
9.1 | 8.0 | 7.3 | 24.4 |
$85 |
| 4FQ20 |
9.4 | 6.9 | 6.8 | 23.1 |
$87 |
| 1FQ21 |
9.3 | 8.2 | 5.5 | 23.0 |
$79 |
| 2FQ21 |
10.7 | 10.1 | 4.9 | 25.7 |
$73 |
(6) Non-compute products consist of retail channel and consumer electronics HDDs
(7) Data center products consist of enterprise HDDs (high-capacity and performance) and enterprise systems
(8) HDD unit volume excludes data storage systems and media
(9) HDD ASP is calculated by dividing HDD revenue by HDD units. Data storage systems are excluded from this calculation, as data storage systems ASP is measured on a per system basis rather than a per drive basis
Revenue in the range of $3.85 billion to $4.05 billion (-2% to +2%) with non-GAAP EPS in the range of $0.55 to $0.75.
Seagate vs. WD for 2FQ21
(revenue and net income in $ million, units in million)
| Seagate | WD | % in favor of WD |
|
| Revenue | 2,623 | 3,943 | +50% |
| Net income | 280 | 62 | -4.5x |
| HDD revenue |
2,425 | 1,909 | -21% |
| SSD revenue |
198 | 2,034 | x10 |
| HDD ASP | $82 | $73 | -11% |


 Subscribe to our free daily newsletter


