


Western Digital: Fiscal 1Q21 Financial Results
-3% Q/Q for revenue, -2% to -7% expected for next quarter
This is a Press Release edited by StorageNewsletter.com on October 29, 2020 at 2:21 pm| (in $ million) | 1Q20 | 1Q21 | Growth |
| Revenue |
4,040 | 3,992 | -3% |
| Net income (loss) | 101 | 196 |
Western Digital Corp. reported fiscal first quarter 2021 financial results.
“I am pleased with our results, as we continued to focus our execution on the massive market opportunity for data storage technology that stems from the ongoing expansion of cloud infrastructure connected to intelligent endpoints and powered by high performance networks,” said David Goeckeler, CEO. “While we are still managing through macro uncertainty, during the quarter we benefited from strength particularly in the retail sector, driven by favorable macro and market dynamics, as well as the brand recognition of our products. Our diversified storage portfolio strategy implemented through our recently announced organizational structure will enable us to accelerate growth, improve our focus, and drive sustainable, long-term shareholder value.”
Note: The company’s fiscal first quarter of 2021 was a 13-week fiscal quarter, compared to a 14-week fiscal quarter a year ago.
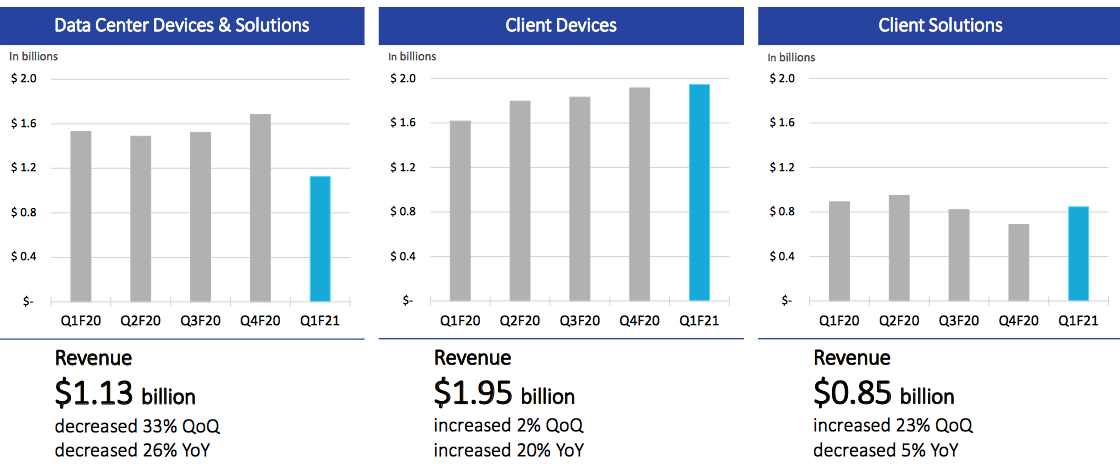
In 1FQ21, Western Digital’s revenue decreased 3% Y/Y to $3.9 billion. The decrease is largely attributable to the uncertainty associated with the global economic contraction and geopolitical headwinds, which resulted in shifts in customer buying patterns impacting data center devices & solutions and client solutions.
In client devices, SSD solutions for notebook and desktops benefited from the acceleration of work from home and remote learning trends. Gaming experienced significant growth as upcoming game consoles transition from hard drive-based storage solutions to flash, powering a more real-time, immersive gaming experience. In addition, mobile revenue more than doubled, driven by recent 5G phone launches and a broadening of end customers within China.
In data center devices & solutions, both capacity enterprise hard drive and enterprise SSD demand were negatively impacted by shifts in customer ordering patterns. Important product transitions in hard drive and flash-based storage solutions also impacted demand trends as customers are still ramping up on these newer products.
In client solutions, the company continued to recover as many brick and mortar customers reopened from Covid-19-related lock downs during the period. In addition, demand related to work from home and distance learning benefited both hard drive and flash-based solutions.
Comments
For 1FQ21, revenue was $3.9 billion, down 9% Q/Q and 3% Y/Y at the upper end of the guidance range ($3.7 to $3.9 billion) provided last August.
The decrease is largely attributable to the uncertainty associated with the global economic contraction and geopolitical headwinds, which resulted in shifts in customer buying patterns impacting data center devices & solutions and client solutions.
After this announcement, WDC's shares increased 3.45%
Revenue trends
Flash and HDD metrics
Flash in 1FQ21
- Flash revenue was $2.1 billion, down 7% Q/Q, but up 27% Y/Y
- Bit shipments were up 1% Q/Q.
- ASP/GB for blended was down 9% Q/Q; like-for-like down 6% Q/Q.
- Flash gross margin was 26.4% down 4.1 percentage points from 4FQ20, as pricing was down more than anticipated.
- WDC completed over 100 qualifications of its second-gen NVMe products.
- Concerning the 20-year old partnership with Kioxia, this later announced the construction of the shelf Fab 7 in Yokkaichi which is expected to commence in the spring of 2021.
HDDs in 1FQ21
- Hard drive revenue was $1.8 billion, down 10% Q/Q and down 23% Y/Y.
- Total exabyte shipments were down 7% Q/Q.
- $79 ASP per drive was down 9% Q/Q.
- The manufacturer produced one million energy assisted drives and completed 100 qualifications, and including with one cloud leader, and have an additional 125 qualifications in process.
- Qualifications have been completed on the 20TB platform and the maker has started shipping for revenue.
- Covid-19-related costs were $28 million, essentially all attributable to HDDs, down from $96 million in the prior quarter.
HDD and flash revenue
| in $ million | 1FQ18 | 1FQ19 | 2FQ19 |
3FQ19 |
4FQ19 |
1FQ20 |
2FQ20 |
3FQ20 |
4FQ20 |
1FQ21 |
4Q20 .1FQ21 growth |
| HDD |
2,610 | 2,494 | 2,060 | 2,064 | 2,128 | 2,408 | 2,396 | 2,114 | 2,049 | 1,844 | -10% |
| Flash |
2,571 | 2,534 | 2,173 | 1,610 | 1,506 | 1,632 | 1,838 | 2,061 |
2,238 | 2,078 | -7% |
| Exabyte metrics | 1FQ19 | 2FQ19 | 3FQ19 | 4FQ19 |
1FQ20 |
2FQ20 |
3FQ20 |
4FQ20 |
1FQ21 |
| Q/Q change in HDD exabytes sold (1) | -6% | -17% | 13% | 14% | 23% | -1% | -6% | -2% | -7% |
| Q/Q change in flash exabytes sold (1) | 28% | 5% | -5% | -1% | 9% | 24% | 7% | 8% | 1% |
| Q/Q change in total exabytes sold (1) | -3% | -15% | 11% | 12% | 22% | 1% | -5% | -1% | -6% |
| Flash metrics | 1FQ19 | 2FQ19 | 3FQ19 | 4FQ19 |
1FQ20 |
2FQ20 |
3FQ20 |
4FQ20 | 1FQ21 |
| Q/Q change in ASP/GB (1) | -16% | -18% | -23% | -6% | 0% | -8% | 5% | 1% | -9% |
(1) Excludes licensing, royalties, and non-memory products.
Volume and HDD Share
(units in million)
| Client compute units (5) |
Non-compute units (6) |
Data centers units (7) |
Total HDDs (8) |
Exabytes Shipped |
ASP (9) |
|
| 2FQ18 |
21.1 | 14.4 | 6.8 | 42.3 |
NA | $63 |
| 3FQ18 |
17.6 | 11.2 | 7.6 | 36.4 |
NA | $72 |
| 4FQ18 |
17.8 | 13.7 | 7.5 | 39.0 |
NA | $70 |
| 1FQ19 | 16.3 | 11.2 | 6.6 | 34.1 | 103.3 | $72 |
| 2FQ19 |
14.0 | 11.3 | 5.1 | 30.2 |
75.9 |
$67 |
| 3FQ19 |
12.9 | 9.3 | 5.6 | 27.8 | 97.5 | $73 |
| 4FQ19 |
12.3 | 9.2 | 6.2 | 27.7 | 111.5 | $75 |
| 1FQ20 |
12.9 | 8.9 | 7.5 | 29.3 | 131 | $81 |
| 2FQ20 |
11.8 | 10.3 | 7.1 | 29.2 | 133.6 | $81 |
| 3FQ20 |
9.1 | 8.0 | 7.3 | 24.4 |
126.6 | $85 |
| 4FQ20 |
9.4 | 6.9 | 6.8 | 23.1 |
125.5 | $87 |
| 1FQ21 |
9.3 | 8.2 | 5.5 | 23.0 |
118.0 | $79 |
(6) Non-compute products consist of retail channel and consumer electronics HDDs
(7) Data center products consist of enterprise HDDs (high-capacity and performance) and enterprise systems
(8) HDD unit volume excludes data storage systems and media
(9) HDD ASP is calculated by dividing HDD revenue by HDD units. Data storage systems are excluded from this calculation, as data storage systems ASP is measured on a per system basis rather than a per drive basis
Revenue is expected to be between $3,750 to $3,950. This range includes $30 million in costs associated with Covid-19 and $50 million in costs associated with the K1 fab.
Seagate vs. WD for 4FQ20
(revenue and net income in $ million, units in million)
| Seagate | WD | % in favor of WD |
|
| Revenue | 2,314 | 3,992 | 73% |
| Net income | 223 | 196 | -12% |
| HDD revenue |
2,137 | 1,844 | -14% |
| SSD revenue |
177 | 2,078 | x12 |
| HDD shipped | NA | 23.0 | NA |
| Average GB/drive | 4,400 | NA | NA |
| Exabytes shipped (HDD) |
114.0 | 118.0 | 4% |
| HDD ASP | $82 | $79 | -4% |


 Subscribe to our free daily newsletter


