


 Quantum: Fiscal 1Q24 Financial Results
Sales down, net loss up, bad outlook
This is a Press Release edited by StorageNewsletter.com on August 9, 2023 at 2:03 pm| (in $ million) | 1Q23 | 1Q24 | Growth |
| Revenue |
97.1 | 91.8 | -5% |
| Net income (loss) | (10.2) | (10.6) |
Quantum Corporation announced financial results for its fiscal first quarter ended June 30, 2023.
1FQ24 Financial Summary
- Revenue was $91.8 million, a decrease of 5% Y/Y
- GAAP gross margin was 38.1%, and non-GAAP gross margin expanded to 38.3%
- Subscription ARR was up 78% Y/Y at $14.6 million
- GAAP net loss was $10.6 million, or ($0.11) per share
- Non-GAAP adjusted net loss was $4.8 million, or ($0.05) per share
- Adjusted EBITDA increased to $0.8 million
Commenting on the results, Jamie Lerner, chairman and CEO, stated: “First quarter revenue was impacted by booking delays; an unanticipated drop in device and media sales late in the quarter; and higher than anticipated weakness in the hyperscale vertical. Our subscription ARR in the quarter increased 78% year-over-year and 9% sequentially as we continue to advance recurring software subscriptions across our customer base.
“Despite the overall decline in quarterly revenue, our global efficiency plan and cost reduction initiatives helped to deliver a 790-basis point sequential improvement in gross margin and a reduction in operating expenses, which together contributed to both sequential and year over year increase in adjusted EBITDA.
“Subsequent to quarter-end, our largest hyperscale customer paused orders due to excess capacity driven by broader macro weakness. This development was unexpected and will have a meaningful impact on our second quarter and full year outlook and further punctuates the importance of transitioning our business to a more stable, subscription-based business model to moderate quarterly volatility.
“Our entire team is fully focused on executing with a high sense of urgency to secure and convert our expanding pipeline of opportunities into customers. This includes aggressively scaling our non-hyperscale businesses and ramping our full portfolio of end-to-end solutions. We are also further tightening spending across the organization, while maintaining our investment in key sales, marketing, and product development initiatives.“
1FQ24 vs. 1FQ23
Revenue for 1FQ24 was $91.8 million, compared to $97.1 million 1FQ23, primarily reflecting a decrease in Primary Storage Systems, Device and Media as well as lower Services business, partially offset by growth in hyperscale Secondary Storage Systems. GAAP gross profit in 1FQ24 was $34.9 million, or 38.1% of revenue, compared to $34.0 million, or 35.1% of revenue, in 1FQ23. Non-GAAP gross profit in 1FQ24 was $35.2 million, or 38.3% of revenue, compared to $34.5 million, or 35.5% of revenue in 1FQ23.
Total GAAP operating expenses in 1FQ24 were $40.8 million, or 44% of revenue, compared to $41.1 million, or 42% of revenue in 1FQ23. Selling, general and administrative expenses were $28.5 million in 1FQ24, compared to $28.3 million in 1FQ23. RD expenses were $10.9 million in 1FQ24, compared to $12.1 million in 1FQ23. Non-GAAP operating expenses in 1FQ244 decreased to $35.5 million from $36.3 million in 1FQ23.
GAAP net loss in 1FQ24 was $10.6 million, or ($0.11) per share, compared to a net loss of $10.6 million, or ($0.13) per share in 1FQ23. Excluding acquisition-related intangible asset costs and stock-based compensation, non-GAAP adjusted net loss in 1FQ24 was $4.8 million, or ($0.05) per share, compared to adjusted net loss of $3.6 million, or ($0.04) per share, in 1FQ23.
Adjusted EBITDA in 1FQ24 improved to $0.8 million, compared to $0.3 million in 1FQ23, reflecting the initial benefits from the company’s recently implemented global efficiency plan and ongoing cost reduction initiatives.
Liquidity and Debt (as of June 30, 2023)
Cash, cash equivalents and restricted cash were $25.7 million, compared to $26.8 million as of June 30, 2022.
Total interest expense for 1FQ24 was $3.2 million compared to $2.1 million for 1FQ23.
Outstanding term loan debt was $88.6 million, compared to $78.4 million as of June 30, 2022. Outstanding borrowings on the revolving credit facility was $17.8 million, compared to $17.3 million as of June 30, 2022.
Guidance
For 2FQ24, the company now expects the following guidance:
- Revenues of $80.0 million, ± $3.0 million
- Non-GAAP gross margin of approximately 42%
- Non-GAAP adjusted net loss per share of ($0.04), plus or minus $0.02
- Adjusted EBITDA of approximately $2.0 million
For FY24, the company expect the following outlook:
- Revenues of $360.0 million, ± $10.0 million
- Non-GAAP gross margin of approximately 42%
- Non-GAAP adjusted net loss per share of ($0.06), plus or minus $0.02
- Adjusted EBITDA of approximately $17.0 million, plus or minus $3 million
Commenting on the guidance, CFO Ken Gianella stated: “Not reflected in our original full year outlook was more pronounced declines in both our hyperscale and media businesses as well as the potential impact of a prolonged entertainment work stoppage. Even with these extraordinary revenue headwinds, our total gross margins are improving with the rotation to a higher revenue contribution from Primary Storage and non-hyperscale Secondary Storage customers. Additionally, we are refining our full year adjusted EBITDA outlook from our prior forecast of at least $20 million, which despite the decline in revenue, reflects the meaningful benefits from our global efficiency plan, including disciplined manufacturing and service operations, as well as strong cost and discretionary spending controls.”
This full year outlook assumes an effective annual tax rate of 25%; Non-GAAP adjusted net loss per share assumes an average basic share count of approximately 93.9 million in 2FQ24 and 94.6 million for FY24.
Comments
Revenue in 1FQ24 was $91.8 million, a decrease of 5% Y/Y and 13% Q/Q, far from estimations ($97±3 million) announced in 4FQ23.
Operational insights
• Late quarter bookings and drop in media sales impact 1FQ24 revenue from guidance
• Gross margin gains on continued operational improvements and shift in revenue mix
• Subscription ARR grew by 78% Y/Y to $14.6 million and 9% Q/Q
• Executing global efficiency plan with improved profitability benefiting 2FQ and beyond
• Largest Hyperscale customer pausing all additional orders for 2FQ4
• Primary and non-Hyperscale Secondary business poised to grow up to 40% Y/Y
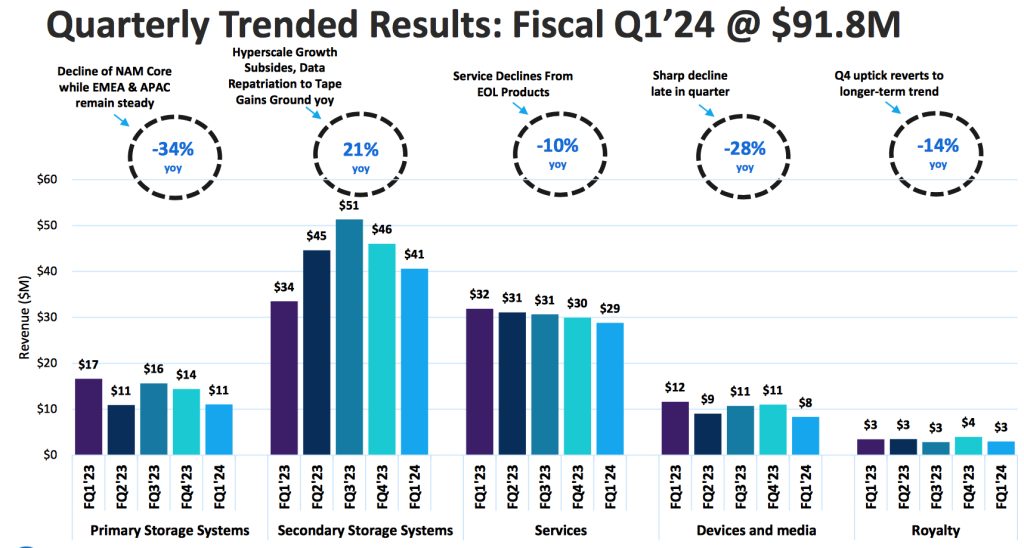
Primary storage revenue was $11.1 million, down approximately 34% Y/Y and 24% sequentially.
Secondary storage systems revenue increased 21% T/Y and decreased 12% Q/Q to $40.6 million or 45% of total revenue.
Services business revenue in 1FQ24 was $28.7 million, down 10% Y/Y, driven by end of service life on older tape product lines. Company anticipates the declines in service revenue to begin to level off later this fiscal year.
Media and devices revenue decreased 28% Y/Y and was down 24% Q/Q to $8.3 million.
Royalties in 1FQ24 were lower and totaled $3 million.
Outlook for 2FQ24 is expected to be $80±3 million or between -22% and -16%, significantly impacted by the recent news from firm's largest customer.
Estimation of sales for FY24 is $360±10 million or between -10% and -13%, much below the figures announced at the end of 4FQ23: $415±10 million.
Fiscal year ended March 31
| (in $ million) | Revenue | Y/Y Growth | Net income (loss) |
| 1998 | 1,189.8 | NA |
170.8 |
| 1999 | 1,302.7 | 9% | (29.5) |
| 2000 | 1,418.9 | 9% | 40.8 |
| 2001 | 1,405.8 | -1% | 160.7 |
| 2002 | 1,087.8 | -23% | 42.5 |
| 2003 | 870.8 | -20% | (264.3) |
| 2004 | 808.3 | -7% | (62.0) |
| 2005 | 794.2 | -2% | (3.5) |
| 2006 | 834.3 | +5% | (41.5) |
| 2007 | 1,016.2 | +22% | (64.1) |
| 2008 | 975.7 | -4% | (60.2) |
| 2009 | 809.0 | -17% | (356.1) |
| 2010 | 681.4 | -16% | 16.6 |
| 2011 | 672.3 | -1% | 4.5 |
| 2012 | 652.4 | -3% | (8.8) |
| 2013 | 587.6 | -10% | (52.4) |
| 2014 | 553.2 | -6% | (21.5) |
| 2015* | 543.7 | -2% | 15.4 |
| 2016* | 479.8 | -12% | (75.6) |
| 2017* | 493.1 | 3% | (2.4) |
| 2018 |
437.7 |
-11% | (43.3) |
| 2019 |
402.7 |
-8% | (42.8) |
| 2020 |
402.9 |
0% | (5.2) |
| 2021 |
349.6 |
-13% | (35.5) |
| 2022 |
372.8 |
7% | (32.3) |
| 1FQ23 |
97.1 |
9% | (10.6) |
| 2FQ23 |
99.1 | 6% | (11.9) |
| 3FQ23 |
111.2 | 15% | (2.2) |
| 4FQ23 |
105.3 | 11% | (13.6) |
| 2023 |
412.8 |
11% | (37.9) |
| 1FQ24 |
91.8 | -5% | (10.6) |
| 2FQ24 (estim.) |
80±3 |
-22%/-16% | NA |
| 2024 (estim.) |
360±10 | -10%/-13% | NA |
* figures as restated


 Subscribe to our free daily newsletter


