


 Quantum: Fiscal 4Q23 Financial Results
Sales and net loss increasing, bad outlook for next 3-month period
This is a Press Release edited by StorageNewsletter.com on June 7, 2023 at 2:02 pm| (in $ million) | 4Q22 | 4Q23 | FY22 | FY23 |
| Revenue | 95.2 | 105.3 | 372.8 | 412.8 |
| Growth | 11% | 11% | ||
| Net income (loss) | (7.8) | (13.6) | (32.3) | (37.9) |
Quantum Corporation announced financial results for its fiscal fourth quarter and fiscal year ended March 31, 2023.
4FQ23 financial summary
- Revenue increased 11% Y/Y to $105.3 million
- GAAP net loss was $13.6 million, or ($0.15) per share
- Annual recurring revenue (ARR) was $156 million
- Subscription ARR was up 81% Y/Y at $13.4 million
- Adjusted non-GAAP net loss was $3.7 million, or ($0.04) per share
- Adjusted EBITDA was $1.0 million
“We ended FY23 with positive momentum as 4FQ23 revenue and EBITDA results exceeded our guidance on improved operational execution,” said Jamie Lerner, chairman and CEO. “We also began to see increased stability across the supply chain through greater availability of parts and lower inflationary costs. Additionally, our focused efforts to improve working capital and decrease inventory yielded positive results as we continue to carefully manage cash flow.
“Having weathered a macro environment marked by a global pandemic, supply chain challenges, and disruptive inflation, we are beginning to see signs of improvement across our business. As we continue to chart our business transformation for improved performance, subsequent to the end of 4FQ23, we implemented a global efficiency plan that includes a cost reduction action which we expect to yield approximately $14 million in annualized savings by the end of fiscal year 2025, with a payback of under six months. Also, to support greater operational flexibility in the near term, we proactively secured an additional $15 million of liquidity and greater covenant flexibility from our current lenders to capitalize on the cost savings initiative and position the company for growth as we bring our recent product innovations to market.
“These actions, combined with our focus on the fastest-growing storage market segment and our investment in sales and marketing to drive future growth, further bolster our business transformation strategy. Although we anticipate the first fiscal quarter to be seasonally lower, we expect a resumption of revenue rotation to higher margin products and EBITDA expansion throughout the remainder of the year.”
4FQ23 results
- Revenue was $105.3 million, compared to $95.2 million in 4FQ22, driven primarily by strong growth with hyperscale customers.
- GAAP gross profit was $31.8 million, or 30.2% of revenue, compared to $36.2 million, or 38.0% of revenue, in t4FQ22. Non-GAAP gross profit in the fourth quarter 2023 was $37.4 million, or 35.5% of revenue.
- Total GAAP operating expenses were $41.3 million, or 39.2% of revenue, compared to $41.8 million, or 44% of revenue, in 4FQ22.
- Selling, general and administrative expenses were $30.6 million, compared to $28.3 million in 4FQ22.
- R&D expenses were $10.6 million, compared to $13.5 million in 4FQ22.
- Non-GAAP operating expenses were down slightly to $37.0 million from $37.2 million in 4FQ22.
- GAAP net loss was $13.6 million, or ($0.15) per share, compared to a net loss of $7.8 million, or ($0.13) per share, in 4FQ22. 4FQ23 GAAP net loss included a $5.3 million non-recurring inventory reserve adjustment. Excluding this inventory adjustment, acquisition-related intangible asset costs and stock-based compensation, non-GAAP adjusted net loss in 4FQ23 was $3.7 million, or ($0.04) per share, compared to adjusted net loss of $2.8 million, or ($0.05) per share, in 4FQ22.
- Adjusted EBITDA was $1.0 million, compared to $0.4 million in 4FQ22, reflecting higher revenue and improved operational performance.
FY23 results
- Revenue of $412.8 million increased 11% Y/Y primarily driven by strong demand from hyperscale customers and the video surveillance business.
- Gross profit was $133.9 million, or 32.5% of revenue, compared to $147.0 million, or 39.4% of revenue, in FY22.
- Total GAAP operating expenses were $159.9 million, or 38.8% of revenue, compared to $160.9 million, or 43.1% of revenue, in FY22.
- Selling, general and administrative expenses were $113.8 million, compared to $108.2 million in FY22.
- R&D expenses were $44.6 million, compared to $51.8 million in FY22.
- Non-GAAP operating expenses were $142.9 million, compared to $142.2 million in FY22.
- GAAP net loss was $38.3 million, or ($0.42) per share, compared to a net loss of $32.3 million, or ($0.55) per share, in FY22.
- Excluding stock compensation, restructuring charges and other non-recurring costs, non-GAAP adjusted net loss was $6.2 million, or ($0.07) per share, compared to an adjusted net loss of $7.2 million, or ($0.12) per share, in FY22.
- Adjusted EBITDA was $11.8 million, compared to $11.8 million in FY22.
- Liquidity and debt (as of March 31, 2023)
- Cash, cash equivalents and restricted cash were $26.2 million, compared to $5.5 million as of March 31, 2022.
- Total interest expense for the 3- and 12-month periods were $3.0 million and $10.6 million, respectively, compared to $2.5 million and $11.9 million for the same periods a year ago.
- Outstanding term loan debt was $74.7 million, compared to $98.7 million as of March 31, 2022. Outstanding borrowings on revolving credit facility was $16.8 million, compared to $17.7 million as of March 31, 2022.
Subsequent to quarter end, we secured additional debt funding from current lenders in the amount of $15.0 million in conjunction with greater covenant flexibility.
Guidance for 1FQ24
- Revenue of $97.0 million ± $3.0 million
- Non-GAAP adjusted net loss per share of ($0.00), plus or minus $0.02
- Adjusted EBITDA of approximately $1.0 million
Guidance for FY24
- Revenue of $415 million ± $10.0 million
- Non-GAAP adjusted earnings per share of $0.01, plus or minus $0.10
- Adjusted EBITDA of at least $20.0 million
This assumes an effective annual tax rate of 25%; non-GAAP adjusted net loss per share assumes an average basic share count of approximately 93.3 million in 1FQ24 and approximately 94.3 million for FY24.
Comments
Quantum recorded its strongest FQ4 revenue since FY17 at $105.3 million, down 5% Q/Q and up 11% Y/Y. Outlook announced last quarter was less than that: $102 million ±$2 million.
Operational insights
• Increased revenue driven by growth in Hyperscaler sales and operational execution
• Progress in end-to-end selling and firm's sales transformation
• Grew subscription ARR by 81% in FY23 to $13.4 million
• Supply chain stabilized with greater parts availability and lower inflationary costs
• Executing on global efficiency plan - cost initiative and secured additional liquidity
Cost reduction initiative
• Annualized net savings of ~$14 million fully realized by FY25
• Impact over 10% of global workforce and multiple locations
• Improve leverage in the business model and global footprint
• Timing ensures continued innovation and operational execution
• Cost ~$8.5 million over 24 months, payback < 6 months
• FY24 non-GAAP P&L savings of ~$7 million from 4FQ23 exit rate
• Savings ~40/60 split between COGS and operating expense
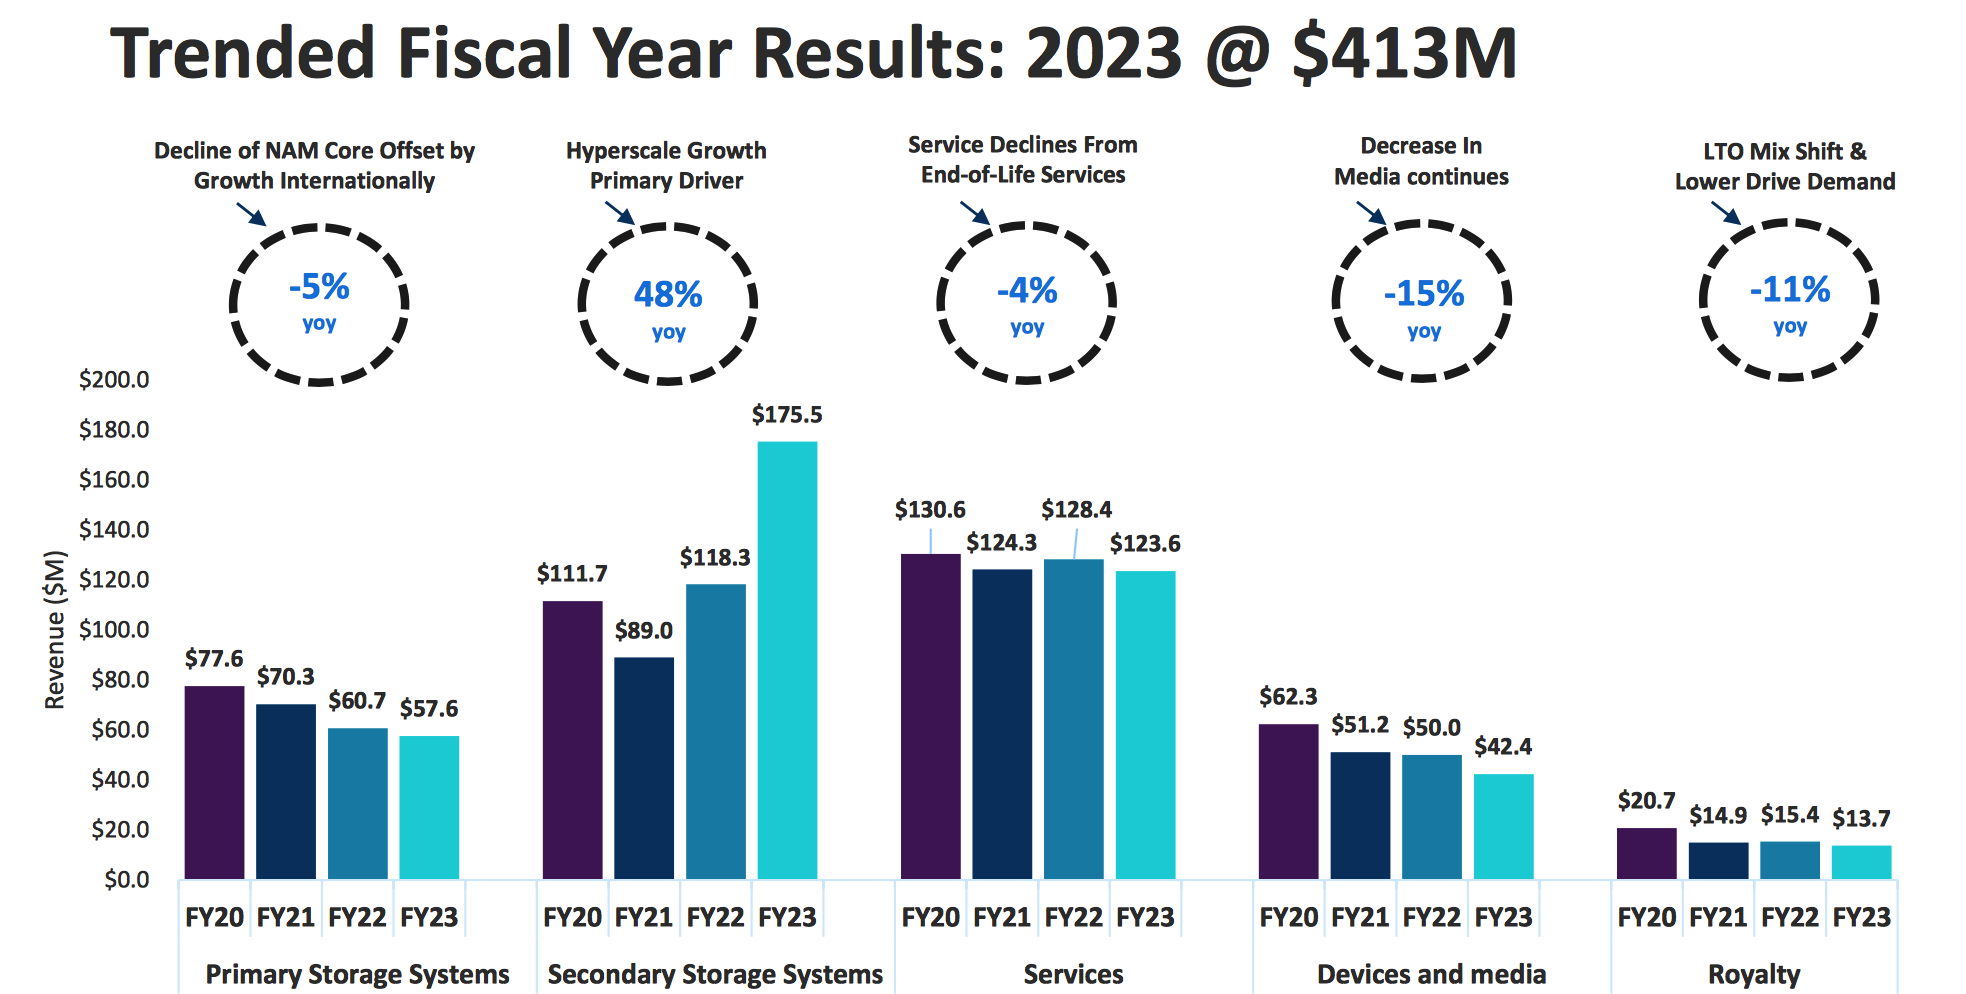
Product revenue
In FY23, it increased $42.8 million, or 19%, as compared to FY22. The primary driver of the increase was demand from firm's large hyperscale customers, as well as continued strong demand globally for data protection and archive solutions. Outside of the tape and hyperscale business, company's remaining secondary and primary storage systems are also offer as a subscription. Quantum anticipates the product revenue portion of its primary and secondary storage systems to decrease as it continues to transition to subscription-based offerings. The devices and media also decreased partially driven by lower volume of LTO media sales.
Service and subscription revenue
It decreased $1.2 million, or 1%, in FY23 compared to FY22. This decrease was due in part to certain long-lived products reaching their end-of-service-life, partially offset by new support bookings and the transition towards subscription-based licensing.
Royalty revenue
The vendor receives royalties from 3rd parties that license LTO media patents through its membership in the LTO consortium. Royalty revenue decreased $1.7 million, or 11% in FY23 as compared to FY22, related to lower overall unit shipments.
Fiscal year ended March 31
| (in $ million) | Revenue | Y/Y Growth | Net income (loss) |
| 1998 | 1,189.8 | NA |
170.8 |
| 1999 | 1,302.7 | 9% | (29.5) |
| 2000 | 1,418.9 | 9% | 40.8 |
| 2001 | 1,405.8 | -1% | 160.7 |
| 2002 | 1,087.8 | -23% | 42.5 |
| 2003 | 870.8 | -20% | (264.3) |
| 2004 | 808.3 | -7% | (62.0) |
| 2005 | 794.2 | -2% | (3.5) |
| 2006 | 834.3 | +5% | (41.5) |
| 2007 | 1,016.2 | +22% | (64.1) |
| 2008 | 975.7 | -4% | (60.2) |
| 2009 | 809.0 | -17% | (356.1) |
| 2010 | 681.4 | -16% | 16.6 |
| 2011 | 672.3 | -1% | 4.5 |
| 2012 | 652.4 | -3% | (8.8) |
| 2013 | 587.6 | -10% | (52.4) |
| 2014 | 553.2 | -6% | (21.5) |
| 2015* | 543.7 | -2% | 15.4 |
| 2016* | 479.8 | -12% | (75.6) |
| 2017* | 493.1 | 3% | (2.4) |
| 2018 |
437.7 |
-11% | (43.3) |
| 2019 |
402.7 |
-8% | (42.8) |
| 2020 |
402.9 |
0% | (5.2) |
| 2021 |
349.6 |
-13% | (35.5) |
| 1FQ22 |
89.1 | 22% | (4.2) |
| 2FQ22 |
93.2 |
9% | (9.3) |
| 3FQ22 |
95.3 |
-3% | (2.7) |
| 4FQ22 |
95.2 | 3% | (7.8) |
| FY22 |
372.8 |
7% | (32.3) |
| 1FQ23 |
97.1 |
9% | (10.6) |
| 2FQ23 |
99.1 | 6% | (11.9) |
| 3FQ23 |
111.2 | 15% | (2.2) |
| 4FQ23 |
105.3 | 11% | (13.6) |
| FY23 |
412.8 |
11% | (37.9) |
| 1FQ24 (estim.) |
97±3 | 3%/1% | NA |
| FY24 (estim.) |
415±10 | 3%/-2% | NA |
* figures as restated


 Subscribe to our free daily newsletter


