


 Quantum: Fiscal 3Q23 Financial Results
Revenue up 12% Q/Q and 17% Y/Y but uninterrupted net loss and bad outlook
This is a Press Release edited by StorageNewsletter.com on February 3, 2023 at 2:02 pm| (in $ million) | 3Q22 | 3Q23 | 9 mo. 22 | 9 mo. 23 |
| Revenue | 95.3 | 111.2 | 277.6 | 307.4 |
| Growth | 17% | 11% | ||
| Net income (loss) | (11.1) | (2.2) | (24.5) | (24.7) |
Quantum Corporation announced financial results for its fiscal third quarter ended December 31, 2022.
“We delivered a solid quarter with revenue increasing 16.6% Y/Y and exceeded the preliminary estimates we announced in early January. Our overall performance was further highlighted by strong EBITDA results,” said Jamie Lerner, chairman and CEO. “Revenue growth in our secondary storage systems combined with continued operational expense management, contributed to a significant Y/Y improvement in our operational performance.“
He continued: “As we begin to see signs of the supply chain normalizing, we are cautiously optimistic. However, as we look forward, we are not standing still. We are actively working to increase margins and profitability; looking to accelerate efforts to drive cost out of our operations; and will continue our innovation to remain a global leader in managing and storing unstructured data.”
3FQ23 vs. 3FQ22
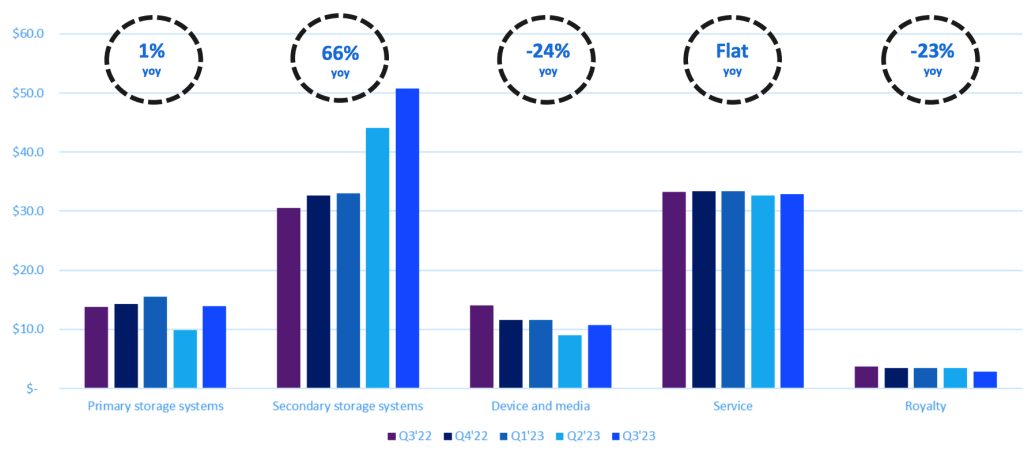
Revenue for 3FQ23 was $111.2 million, compared to $95.3 million in 3FQ22 driven by higher Secondary Storage Products. GAAP gross profit 3FQ23 was $40.3 million, or 36.2% of revenue, compared to $35.2 million, or 36.9% of revenue, 3FQ22 due to product mix.
Total GAAP operating expenses 3FQ23 were $38.5 million, or 34.6% of revenue, compared to $42.4 million, or 44.5% of revenue, in 3FQ22 due to restructuring and other cost saving measures. Selling, general and administrative expenses were $27.3 million in 3FQ23, compared to $27.3 million 2FQ23. R&D expenses were $11.3 million in 3FQ23, compared to $14.6 million in 3FQ22. Non-GAAP operating expenses in 3FQ23 decreased to $34.5 million from $36.3 million in 3FQ22.
GAAP net loss in 3FQ23 was $2.2 million, or ($0.02) per share, compared to a net loss of $11.1 million, or ($0.19) per share, in 3FQ22. Non-GAAP adjusted net income in 3FQ23 was $1.6 million, or $0.02 per diluted share, compared to adjusted net loss of $4.6 million, or ($0.08) per share, in 3FQ22.
Adjusted EBITDA in 3FQ23 was $6.3 million, compared to $0.8 million in 3FQ22 on higher revenue and improved operational performance.
Liquidity and debt
- Cash and cash equivalents were $26.0 million as of December 31, 2022, compared to $4.0 million as of December 31, 2021.
- Outstanding term loan debt was $75.9 million as of December 31, 2022, compared to $98.8 million as of December 31, 2021. Outstanding borrowings on the Company’s revolving credit facility were $27.7 million as of December 31, 2022, compared to $7.6 million as of December 31, 2021.
- Total interest expense 3FQ23 was $2.7 million compared to $2.4 million during 3FQ22.
Guidance
The company expects the following guidance for 4FQ23:
- Revenue of $102 million, ±$2 million
- Non-GAAP adjusted net loss per share of ($0.04), plus or min$0.02
- Adjusted EBITDA of approximately $0.5 million
Insight into 4FQ23 outlook sees Y/Y revenue growth of approximately 7% at the midpoint during the traditional low point of the year. The company anticipates a temporal gross margin compression of approximately 2 to 3 points sequentially due to product mix, combined with higher operating expense on end-of-year commissions and other inflationary increases.
Non-GAAP adjusted net loss per share assumes an average basic share count of approximately 93.3 million in 4FQ23.
Comments
The company records revenue of $111.2 million during the quarter up 17% Y/Y and 12% Q/Q. Guidance announced in 2FQ23 was $103 million, ±$3 million. That's the highest quarterly revenue in 5 years but with uninterrupted net loss since 4FQ20.
Trended revenue results
Recurring revenue transition continued to accelerate with more than 255 customers utilizing firm's subscription solutions, up 30% sequentially and 98% Y/Y.
This 3FQ23 represents 5th sequential quarter of bookings exceeding revenue.
$26 million of customer orders in the quarter could not be fulfilled, which had a major impact on revenue, gross margins, earnings and adjusted EBITDA.
ARR grew to $11.2 million on over 660 customers.
Fiscal year ended March 31
| (in $ million) | Revenue | Y/Y Growth | Net income (loss) |
| 1998 | 1,189.8 | NA |
170.8 |
| 1999 | 1,302.7 | 9% | (29.5) |
| 2000 | 1,418.9 | 9% | 40.8 |
| 2001 | 1,405.8 | -1% | 160.7 |
| 2002 | 1,087.8 | -23% | 42.5 |
| 2003 | 870.8 | -20% | (264.3) |
| 2004 | 808.3 | -7% | (62.0) |
| 2005 | 794.2 | -2% | (3.5) |
| 2006 | 834.3 | +5% | (41.5) |
| 2007 | 1,016.2 | +22% | (64.1) |
| 2008 | 975.7 | -4% | (60.2) |
| 2009 | 809.0 | -17% | (356.1) |
| 2010 | 681.4 | -16% | 16.6 |
| 2011 | 672.3 | -1% | 4.5 |
| 2012 | 652.4 | -3% | (8.8) |
| 2013 | 587.6 | -10% | (52.4) |
| 2014 | 553.2 | -6% | (21.5) |
| 2015* | 543.7 | -2% | 15.4 |
| 2016* | 479.8 | -12% | (75.6) |
| 2017* | 493.1 | 3% | (2.4) |
| 2018 |
437.7 |
-11% | (43.3) |
| 2019 |
402.7 |
-8% | (42.8) |
| 1FQ20 |
105.6 |
-2% | (3.8) |
| 2FQ20 |
105.8 |
18% | (2.3) |
| 3FQ20 |
103.3 | 1% | 4.7 |
|
4FQ20 |
88.2 |
-15% | (3.8) |
| 2020 |
402.9 |
0% | (5.2) |
| 1FQ21 |
73.3 |
-31% | (10.7) |
| 2FQ21 | 85.8 |
-19% | (4.6) |
| 3FQ21 |
98.0 |
5% | (2.7) |
| 4FQ21 |
92.4 | 5% | (17.5) |
| 2021 |
349.6 | -13% | (35.5) |
| 1FQ22 |
89.1 | 22% | (4.2) |
| 2FQ22 |
93.2 |
9% | (9.3) |
| 3FQ22 |
95.3 |
-3% | (2.7) |
| 4FQ22 |
95.2 | 3% | (7.8) |
| FY22 |
372.8 |
7% | (32.3) |
| 1FQ23 |
97.1 |
9% | (10.6) |
| 2FQ23 |
99.1 | 6% | (11.9) |
| 3FQ23 |
111.2 | 15% | (2.2) |
| 4FQ23 (estim.) |
102±2 | 9%-5% | NA |
* figures as restated


 Subscribe to our free daily newsletter


