


 Quantum: Fiscal 1Q23 Financial Results
Revenue up 9% Y/Y to $97.1 million with $10.6 million net loss
This is a Press Release edited by StorageNewsletter.com on October 3, 2022 at 2:02 pm| (in $ million) | 1Q22 | 1Q23 | Growth |
| Revenue |
89.1 | 97.1 | 9% |
| Net income (loss) | (4.2) | (10.6) |
We missed this financial news dated August 4, 2022. Here it is. Editor
Quantum Corporation announced financial results for its fiscal first quarter ended June 30, 2022.
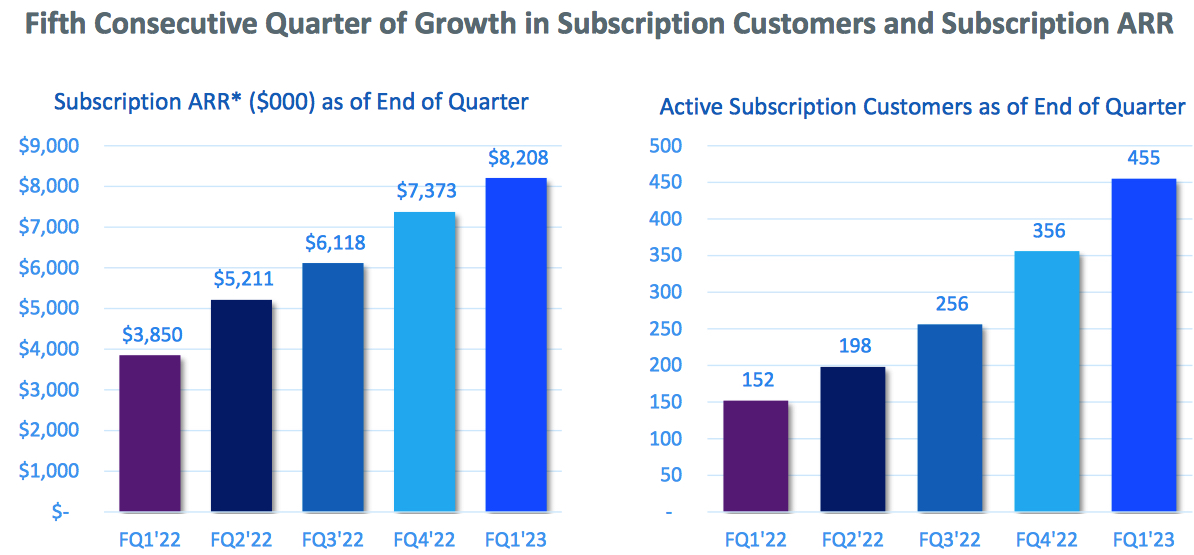
“Revenue was above the high-end of our guidance at $97.1 million, primarily driven by continued robust demand from our hyperscale customers and significant growth in our video surveillance business,” stated Jamie Lerner, chairman and CEO. “With all of Quantum’s products now available as a software offering, we continue to secure a growing number of subscription-based customers that reached over 450 in the quarter, representing the 5th consecutive sequential increase. As further evidence of our ongoing progress to drive recurring revenue, subscription software ARR expanded 11% sequentially to $8.2 million.
“During the quarter, we realized the initial benefits from our enhanced supply chain strategies and cost reduction initiatives, as demonstrated by our better than expected revenue results. Following a series of cost reductions we implemented in June, operating expenses decreased by $0.6 million sequentially with a more significant reduction of $1.5 to $2.0 million per quarter expected in the second half of fiscal 2023.
“In summary, we have and continue to take the necessary steps to improve the company’s financial profile and future operating performance. Looking ahead to the coming quarter and year, we are committed to disciplined execution on our initiatives aimed at driving top-line growth as well as increased operational efficiency and margin expansion, which together we expect to contribute to higher adjusted EBITDA and earnings.”
1FQ23 vs. 4FQ22
- Revenue was $97.1 million compared to $95.2 million in the prior quarter. Gross profit was $34.0 million, or 35% of revenue, compared to $36.2 million, or 38% of revenue, in 4FQ22. Gross margin reflected an anticipated peak in purchase price variance driven from constraints in the supply chain combined with revenue mix that was more heavily weighted towards hyperscale customers. Assuming no meaningful deterioration in the overall market environment or supply chain dynamics, the company believes gross margin in 1FQ23 represents a low-point from which margins will improve during FY23.
- Total GAAP operating expenses decreased to $41.1 million, or 42% of revenue, compared to $41.8 million, or 44% of revenue, in the prior quarter. Selling, general and administrative expenses were $28.3 million, flat compared to 4FQ22. R&D expenses were $12.1 million, compared to $13.5 million in the prior quarter. Non-GAAP operating expenses decreased to $36.3 million from $37.2 million in the prior quarter.
- GAAP net loss was $10.6 million, or ($0.13) per share, compared to a net loss of $7.8 million, or ($0.13) per share, in 4FQ22. Excluding stock compensation, restructuring charges and other non-recurring costs, non-GAAP adjusted loss was $3.6 million, or ($0.04) per share, compared to adjusted net loss of $2.8 million, or ($0.05) per share, in the prior quarter.
- Adjusted EBITDA was $0.3 million, compared to $0.4 million in the prior quarter.
Balance Sheet and Liquidity
- Cash and cash equivalents including restricted cash was $26.8 million as of June 30, 2022, compared to $5.5 million as of March 31, 2022.
- During the quarter, the company used proceeds from its completed Rights Offering to pay down $20.0 million of outstanding long-term debt. A portion of the proceeds were also used to fund working capital needs, which included a primarily seasonality driven decrease in deferred revenue of $13.6 million.
- Outstanding term loan debt was $78.4 million as of June 30, 2022, compared to $98.7 million as of March 31, 2022. Outstanding borrowings on the company’s revolving credit facility were $17.3 million as of June 30, 2022, compared to $17.7 million as of March 31, 2022.
- Total interest expense in 1FQ23 was $2.1 million compared to $2.5 million in the prior quarter and $3.9 million during 1FQ22.
Outlook
Based on currently committed supply, the company expects the following guidance range for 2FQ23:
- Revenue of $95 million, ±$4 million
- Non-GAAP adjusted net loss of ($1.5 million), ±$1 million
- Non-GAAP adjusted net loss per share of ($0.02), ±$0.01
- Adjusted EBITDA of $2.5 million, ±$1 million
Comments
Revenue came above the high end of guidance at $97.1 million, representing an increase of 9% Y/Y and 2% compared to $95.2 million in the prior quarter.
Growth was driven by continued strong hyperscale sales as well as sequential growth in video surveillance business.
Backlog at the end of 1FQ23 was $47 million, primarily reflecting the timing of large orders and subsequently increased to a new record of approximately $67 million at July 31, 2022. Approximately 75% of the first quarter ending backlog was related to hyperscaler customers and approximately $25 million of the ending backlog was shippable to customers if company was not supply constrained. Although it is seeing some signs of improved supply, it continue to be constrained primarily on tape drives as well as broad-based shortages of components.
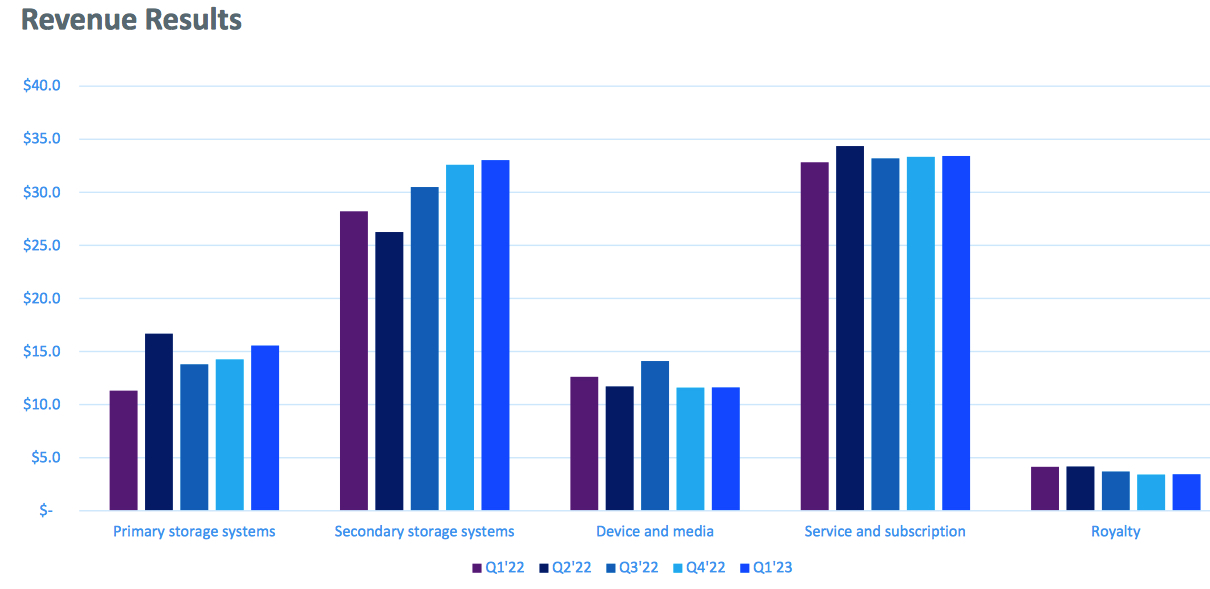
During 1FQ23, secondary storage revenues were up 1% sequentially, primarily driven by ongoing strong demand from hyperscaler customers, largely offset by a decrease in backup and data protection products. Primary storage systems as up 9% sequentially, primarily driven by an increase in shipments of video surveillance solutions.
Currently, Quantum has over 10,000 active customers and 23,000 systems under support contract, which represents a potential toward growing recurring revenue over the next few years.
It has close to 1,000 customers now using the MyQuantum Service Delivery Platform announced in April. And it now has over 2,500 customers and close to 4,000 products connected to company's Cloud-Based Analytics software, it is collecting hundreds of thousands of data points to help customers improve their daily operations.
At quarter end, the cumulative number of customers under a subscription contract increased to over 450 active customers, which represents 200% Y/Y growth and sequential growth of 29%.
Next quarter the firm expects revenue of $95 million, ±$4 million, or -6% to +2% Q/Q.
Fiscal year ended March 31
| (in $ million) | Revenue | Y/Y Growth | Net income (loss) |
| 1998 | 1,189.8 | NA |
170.8 |
| 1999 | 1,302.7 | 9% | (29.5) |
| 2000 | 1,418.9 | 9% | 40.8 |
| 2001 | 1,405.8 | -1% | 160.7 |
| 2002 | 1,087.8 | -23% | 42.5 |
| 2003 | 870.8 | -20% | (264.3) |
| 2004 | 808.3 | -7% | (62.0) |
| 2005 | 794.2 | -2% | (3.5) |
| 2006 | 834.3 | +5% | (41.5) |
| 2007 | 1,016.2 | +22% | (64.1) |
| 2008 | 975.7 | -4% | (60.2) |
| 2009 | 809.0 | -17% | (356.1) |
| 2010 | 681.4 | -16% | 16.6 |
| 2011 | 672.3 | -1% | 4.5 |
| 2012 | 652.4 | -3% | (8.8) |
| 2013 | 587.6 | -10% | (52.4) |
| 2014 | 553.2 | -6% | (21.5) |
| 2015* | 543.7 | -2% | 15.4 |
| 2016* | 479.8 | -12% | (75.6) |
| 2017* | 493.1 | 3% | (2.4) |
| 2018 |
437.7 |
-11% | (43.3) |
| 2019 |
402.7 |
-8% | (42.8) |
| 1FQ20 |
105.6 |
-2% | (3.8) |
| 2FQ20 |
105.8 |
18% | (2.3) |
| 3FQ20 |
103.3 | 1% | 4.7 |
|
4FQ20 |
88.2 |
-15% | (3.8) |
| 2020 |
402.9 |
0% | (5.2) |
| 1FQ21 |
73.3 |
-31% | (10.7) |
| 2FQ21 | 85.8 |
-19% | (4.6) |
| 3FQ21 |
98.0 |
5% | (2.7) |
| 4FQ21 |
92.4 | 5% | (17.5) |
| 2021 |
349.6 | -13% | (35.5) |
| 1FQ22 |
89.1 | 22% | (4.2) |
| 2FQ22 |
93.2 |
9% | (9.3) |
| 3FQ22 |
95.3 |
-3% | (2.7) |
| 4FQ22 |
95.2 | 3% | (7.8) |
| FY22 |
372.8 |
7% | (32.3) |
| 1FQ23 |
97.1 |
9% | (10.6) |
| 2FQ23 estim. |
95±4 |
-6%/+2% | NA |
* figures as restated


 Subscribe to our free daily newsletter


