


 Box: Fiscal 1Q24 Financial Results
6% growth in sales, but net loss increasing
This is a Press Release edited by StorageNewsletter.com on June 12, 2023 at 2:02 pm| (in $ million) | 1Q23 | 1Q24 | Growth |
| Revenue |
238.4 | 251.9 | 6% |
| Net income (loss) | (4.7) | (8.3) |
Box, Inc. announced preliminary financial results for the first quarter of fiscal year 2024, which ended April 30, 2023.
“In 1FQ24 we delivered revenue, operating margin and EPS above our guidance ranges, a testament to the value of the Box Content Cloud platform and the execution we have been driving as a company,” said Aaron Levie, co-founder and CEO. “In FY24, our pace of innovation continues to accelerate as we delivered on key roadmap milestones such as the availability of Box Canvas and the next gen of Box Shuttle. And our innovation expands even further with Box AI, which leverages the power of AI to unlock the value of our customers’ content and fundamentally change how work gets done.“
“Our sharp focus on delivering profitable growth in this dynamic macro environment was exemplified by our strong 1FQ24 results, with free cash flow growth of 19% Y/Y,” said Dylan Smith, co-founder and CFO. “We remain committed to delivering consistent Y/Y bottom line improvements, and we are reiterating our target of delivering revenue growth plus free cash flow margin of 35% in FY24.”
1FQ24 Highlights
• Revenue was $251.9 million, a 6% increase from revenue for 1FQ23 of $238.4 million, or 10% growth on a constant currency basis.
• Remaining performance obligations as of April 30, 2023, were $1.179 billion, a 17% increase from remaining performance obligations as of April 30, 2022 of $1.005 billion, or 19% growth on a constant currency basis.
• Billings were $191.9 million, an 11% increase from billings for 1FQ23 of $172.2 million, or 15% growth on a constant currency basis.
• GAAP gross profit was $190.2 million, or 75.5% of revenue. This compares to a GAAP gross profit of $176.2 million, or 73.9% of revenue, in 1FQ23.
• Non-GAAP gross profit was $196.2 million, or 77.9% of revenue. This represents 8% growth from non-GAAP gross profit of $182.0 million, or 76.3% of revenue, in 1FQ23.
• GAAP operating income was $8.3 million, or 3.3% of revenue. This compares to a GAAP operating income of $0.6 million, or 0.3% of revenue, in 1FQ23.
• Non-GAAP operating income was $57.4 million, or 22.8% of revenue. This represents 17% growth from non-GAAP operating income of $49.2 million, or 20.6% of revenue, in 1FQ23.
• GAAP diluted net income per share attributable to common stockholders was $0.02 on 150.4 million weighted-average shares outstanding. This compares to GAAP diluted net loss per share attributable to common stockholders of $0.06 in 1FQ23 on 144.7 million weighted-average shares outstanding. GAAP net income per share attributable to common stockholders includes a negative impact of $0.05 from unfavorable foreign exchange rates.
• Non-GAAP diluted net income per share attributable to common stockholders was $0.32. This compares to non-GAAP diluted net income per share attributable to common stockholders of $0.23 in 1FQ23. Non-GAAP net income per share attributable to common stockholders includes a negative impact of $0.05 from unfavorable foreign exchange rates.
• Net cash provided by operating activities was $124.9 million, a 16% increase from net cash provided by operating activities of $107.7 million in 1FQ23.
• Non-GAAP free cash flow was $108.2 million, a 19% increase from non-GAAP free cash flow of $90.9 million in 1FQ23.
2FQ24 guidance
• Revenue is expected to be in the range of $260 million to $262 million, up 7% Y/Y at the high-end of the range, or 11% growth on a constant currency basis.
• GAAP operating margin is expected to be approximately 3%, and non-GAAP operating margin is expected to be approximately 24%.
• GAAP net income per share attributable to common stockholders is expected to be in the range of $0.01 to $0.02. GAAP EPS guidance includes an expected negative impact of $0.05 from unfavorable exchange rates.
• Non-GAAP diluted net income per share attributable to common stockholders is expected to be in the range of $0.34 to $0.35. Non-GAAP EPS guidance includes an expected negative impact of $0.05 from unfavorable exchange rates.
• Weighted-average diluted shares outstanding are expected to be approximately 150 million.
FY24 guidance
• Revenue is expected to be in the range of $1.045 billion to $1.055 billion, up 6% Y/Y at the high-end of the range, or 10% growth on a constant currency basis.
• GAAP operating margin is expected to be approximately 5%, and non-GAAP operating margin is expected to be 25.5%.
• GAAP net income per share attributable to common stockholders is expected to be in the range of $0.17 to $0.23. FY24 GAAP EPS guidance includes an expected negative impact of $0.20 from unfavorable exchange rates.
• Non-GAAP diluted net income per share attributable to common stockholders is expected to be in the range of $1.44 to $1.50. This represents an increase from Box’s previous guidance provided on March 1, 2023, which was $1.42 to $1.48. FY24 non-GAAP EPS guidance includes an expected negative impact of $0.20 from unfavorable exchange rates.
• Weighted-average diluted shares outstanding are expected to be approximately 151 million.
Comments
In 1FQ24, Box delivered revenue of $252 million, up 6% Y/Y, above the high-end of guidance, and representing 10% Y/Y growth on a constant currency basis, and 3% Q/Q.
Also EPS and operating margin results were above the high-end of guidance.
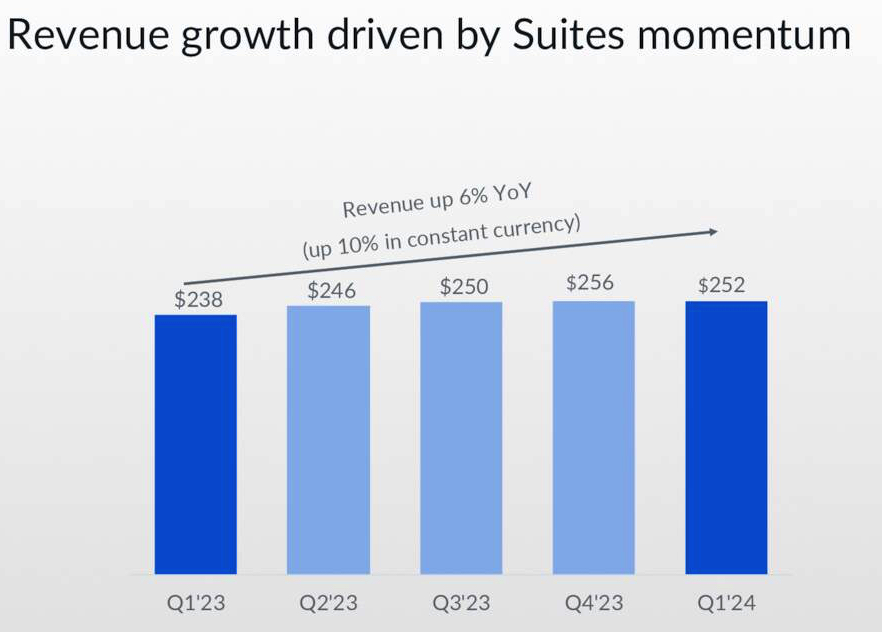
1FQ24 billings of $192 million grew 11% Y/Y, ahead of guidance of a mid-single-digit growth rate, and representing 15% growth in constant currency.
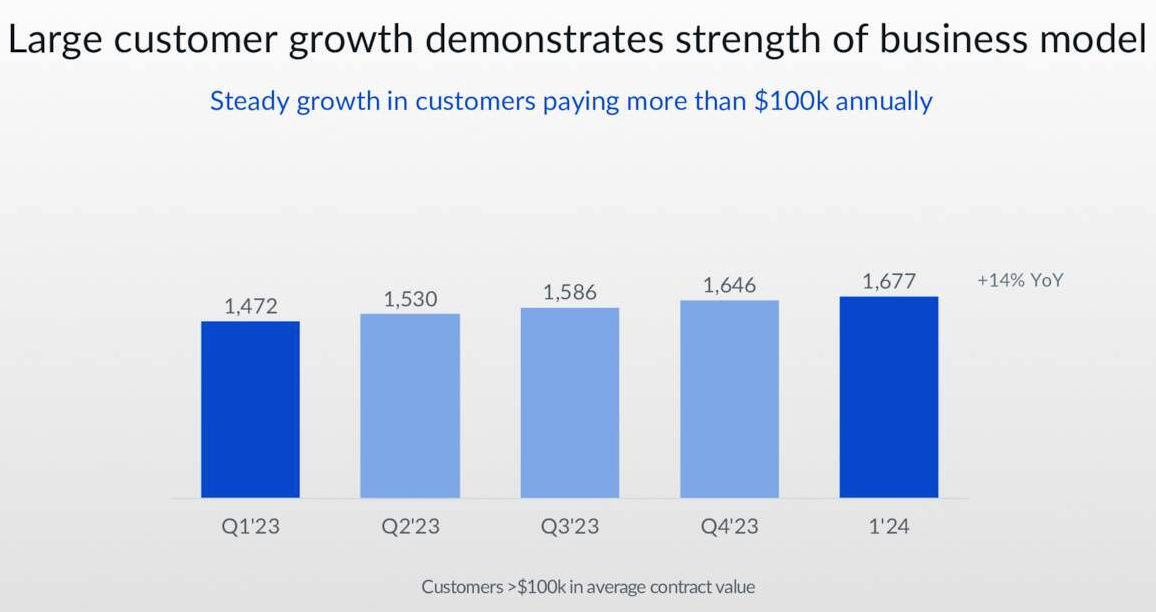
The company now have 1,677 total customers paying more than $100,000 annually, an increase of 14% Y/Y.
Latest multi-product offering, Enterprise Plus, continues to be well over 90% of firm's Suites sales in large deals, with Suites comprising 69% of deals over $100,000 in 1FQ24. The company saw consistent Suites attach rates in large deals across all of its geographies.
Revenue and net income (loss) in $million
| Period | Revenue | Y/Y growth | Net income (loss) |
| FY11 | 21.1 | NA | (53.3) |
| FY12 | NA | NA | NA |
| FY13 | 58.8 | NA | (112.6) |
| FY14 | 124.2 | 112% | (168.6) |
| FY15 | 216.4 | 74% | (168.2) |
| FY16 | 302.7 | 40% | (202.9) |
| FY17 | 398.6 | 32% | (150.8) |
| FY18 | 506.1 | 27% | (155.0) |
| FY19 | 608.4 | 20% | (134.6) |
| FY20 | 696.2 | 14% | (144.3) |
| FY21 | 770.8 | 11% | (43.4) |
| FY22 | 192.3 | 11% | (7.7) |
| FY23 | 990.9 | 13% | 26.8 |
| 1FQ24 | 251.9 | 6% | (8.3) |
| 2FQ24 (estim.) | 260-262 | 7% | NA |
| FY24 (estim.) |
1,045-1,055 | 5%-6% | NA |
* Estimations
Note: IPO in 2015 raising $175 million


 Subscribe to our free daily newsletter


