


 Box: Fiscal 4Q23 Financial Results
Revenue up 10% Y/Y for quarter and 13% for FY23 with higher net income, $1 billion sales expected in FY24
This is a Press Release edited by StorageNewsletter.com on March 17, 2023 at 2:01 pm| (in $ million) | 4Q22 | 4Q23 | FY22 | FY23 |
| Revenue | 233.4 | 256.5 | 874.3 | 990.9 |
| Growth | 10% | 13% | ||
| Net income (loss) | (4.3) | 20.5 | (41.5) | 26.8 |
Box, Inc. announced preliminary financial results for the fourth quarter and fiscal year 2023, which ended January 31, 2023.
“Fiscal 2023 was another strong year for Box, as we achieved a $1 billion annual revenue run rate on a quarterly basis and significantly expanded our operating margins,” said Aaron Levie, co-founder and CEO. “In this challenging environment more enterprises are turning to Box’s Content Cloud to drive up productivity in their organization, simplify their IT stack, and optimize spend, while leveraging Box’s advanced security capabilities to protect their most important data from a wide range of threats. By aligning our platform with our customers’ most pressing priorities we deliver increased value to both our customers and shareholders.”
“Operational excellence and a sharp focus on our bottom line allowed us to deliver a combined revenue growth plus free cash flow margin outcome in fiscal 2023, up significantly Y/Y,” said Dylan Smith, co-founder and CFO. “It is clear our multi-year effort to lower our cost structure while investing to drive durable, long-term growth is enabling us to deliver a continued healthy balance of growth and profitability in FY24 and beyond.”
4FQ23 Highlights
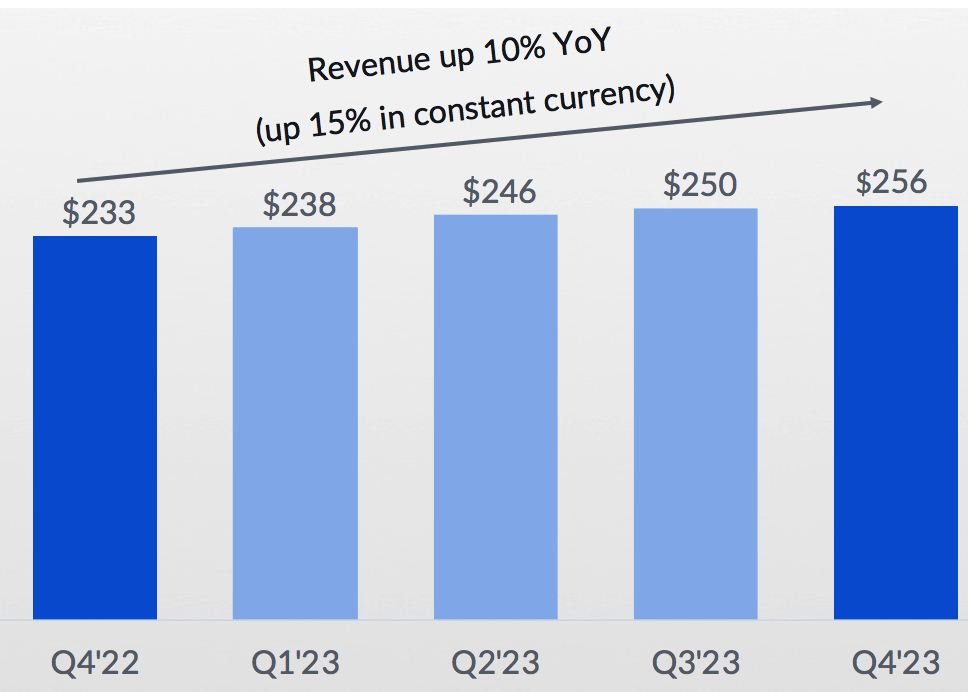
• Revenue was $256.5 million, a 10% increase from revenue for 4FQ22 of $233.4 million, or 15% growth on a constant currency basis.
• Remaining performance obligations (RPO) as of January 31, 2023, were $1.245 billion, a 16% increase from remaining performance obligations as of January 31, 2022 of $1.071 billion, or 21% growth on a constant currency basis.
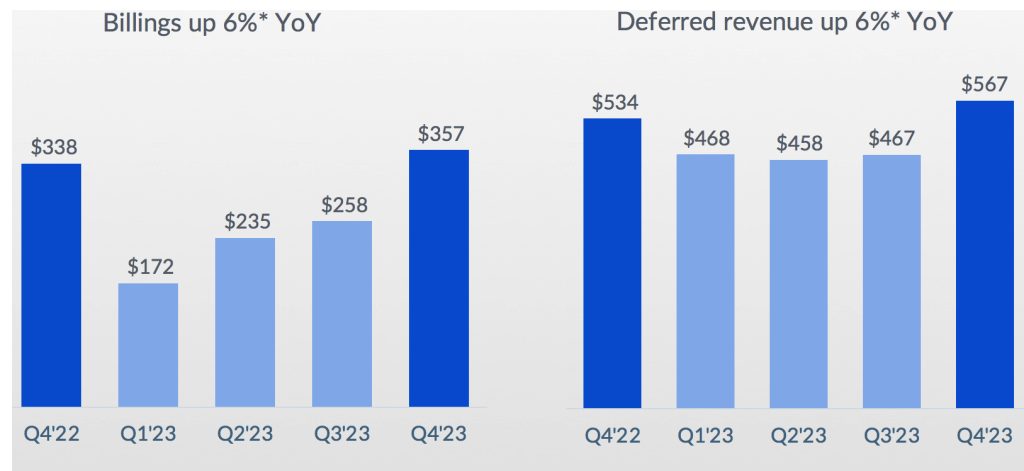
• Billings were $357.1 million, a 6% increase from billings for 4FQ22 of $337.9 million, or 9% growth on a constant currency basis.
• GAAP gross profit was $195.5 million, or 76.2% of revenue. This compares to a GAAP gross profit of $168.7 million, or 72.3% of revenue, in 4FQ22.
• Non-GAAP gross profit was $201.3 million, or 78.5% of revenue. This compares to a non-GAAP gross profit of $175.2 million, or 75.1% of revenue, in 4FQ22.
• GAAP operating income was $19.7 million, or 7.7% of revenue. This compares to a GAAP operating loss of $0.2 million, or negative 0.1% of revenue, in 4FQ22.
• Non-GAAP operating income was $66.6 million, or 26.0% of revenue. This compares to a non-GAAP operating income of $48.5 million, or 20.8% of revenue, in 4FQ22.
• GAAP net income per share attributable to common stockholders, basic and diluted, was $0.10 on 143.6 million and 150.5 million weighted-average shares outstanding, respectively. This compares to a GAAP net loss per share attributable to common stockholders, basic and diluted, of $0.06 in 4FQ22 on 148.3 million weighted-average shares outstanding. GAAP net income per share attributable to common stockholders in 4FQ23 includes a negative impact of $0.05 from unfavorable foreign exchange rates.
• Non-GAAP net income per share attributable to common stockholders, diluted, was $0.37. This compares to a non-GAAP net income per share attributable to common stockholders, diluted, of $0.24 in 4FQ22. Non-GAAP net income per share attributable to common stockholders in the fourth quarter of fiscal year 2023 includes a negative impact of $0.05 from unfavorable foreign exchange rates.
• Net cash provided by operating activities was $92.2 million, an increase of 87% from net cash provided by operating activities of $49.2 million in 4FQ22.
• Non-GAAP free cash flow was $74.7 million, an increase of 124% from non-GAAP free cash flow of $33.3 million in 4FQ22.
FY23 Financial Highlights
• Revenue was $990.9 million, a 13% increase from revenue for FY22 of $874.3 million, or 17% growth on a constant currency basis.
• Billings $1.022 billion, a 9% increase from billings for FY22 of $941.9 million, or 15% growth on a constant currency basis.
• GAAP gross profit was $738.3 million, or 74.5% of revenue. This compares to a GAAP gross profit of $624.8 million, or 71.5% of revenue, in FY22.
• Non-GAAP gross profit was $761.9 million, or 76.9% of revenue. This compares to a non-GAAP gross profit of $650.1 million, or 74.4% of revenue, in FY22.
• GAAP operating income was $36.8 million, or 3.7% of revenue. This compares to a GAAP operating loss of $27.6 million, or negative 3.2% of revenue, in FY22.
• Non-GAAP operating income was $229.0 million, or 23.1% of revenue. This compares to a non-GAAP operating income of $173.4 million, or 19.8% of revenue, in FY22.
• GAAP net income per share attributable to common stockholders, basic and diluted, was $0.06 on 143.6 million and 150.2 million weighted-average shares outstanding, respectively. This compares to a GAAP net loss per share attributable to common stockholders, basic and diluted, of $0.35 in FY22 on 155.6 million weighted-average shares outstanding. GAAP net income per share attributable to common stockholders in FY23 includes a negative impact of $0.17 from unfavorable foreign exchange rates.
• Non-GAAP net income per share attributable to common stockholders, diluted, was $1.20. This compares to a non-GAAP net income per share attributable to common stockholders, diluted, of $0.85 in FY22. Non-GAAP net income per share attributable to common stockholders in fiscal year 2023 includes a negative impact of $0.17 from unfavorable foreign exchange rates.
• Net cash provided by operating activities was $298.0 million, an increase of 27% from net cash provided by operating activities of $234.8 million in FY22. Net cash provided by operating activities was 30% of revenue in FY23.
• Non-GAAP free cash flow was $238.4 million, an increase of 40% from non-GAAP free cash flow of $170.2 million in FY22. Non-GAAP free cash flow was 24% of revenue in FY23.
1FQ24 Guidance
• Revenue is expected to be in the range of $248 million to $250 million, up 5% Y/Y at the high end of the range, or 10% growth on a constant currency basis.
• GAAP operating margin is expected to be approximately 0.5%, and non-GAAP operating margin is expected to be approximately 21%.
• GAAP net loss per share attributable to common stockholders is expected to be in the range of $0.04 to $0.03. GAAP EPS guidance includes an expected negative impact of $0.06 from unfavorable foreign exchange rates.
• Non-GAAP diluted net income per share attributable to common stockholders is expected to be in the range of $0.26 to $0.27. Non-GAAP EPS guidance includes an expected negative impact of $0.06 from unfavorable foreign exchange rates.
• Weighted-average basic and diluted shares outstanding are expected to be approximately 145 million and 154 million, respectively.
FY24 Guidance
• Revenue is expected to be in the range of $1.050 billion to $1.060 billion, up 7% Y/Y at the high end of the range, or 10% growth on a constant currency basis.
• GAAP operating margin is expected to be approximately 4.5%, and non-GAAP operating margin is expected to be approximately 25%.
• GAAP net income per share attributable to common stockholders is expected to be in the range of $0.17 to $0.23. FY24 GAAP EPS guidance includes an expected negative impact of $0.14 from unfavorable foreign exchange rates.
• Non-GAAP diluted net income per share attributable to common stockholders is expected to be in the range of $1.42 to $1.48. FY24 Non-GAAP EPS guidance includes an expected negative impact of $0.14 from unfavorable foreign exchange rates.
• Weighted-average basic and diluted shares outstanding are expected to be approximately 145 million and 153 million, respectively.
Comments
At the end of the former quarter, Box anticipated revenue of $255 to $257 million for 4FQ23. Final result is $256.5 million or on top of guidance, up 10% Y/Y (15% in constant currency) and 3% Q/Q.
Revenue growth driven by Suites momentun
Billings and differed revenue
The company continues to enable more new and existing customers to recognize the value of the Box platform with increased adoption of multiproduct offerings in 4FQ23. Enterprise Plus, its latest suite offering, was over 90% of its suite sales in large deals with suites now representing 72% of deals over $100,000, up from 65% a year ago. The firm saw continued solid suites attach rates in large deals across all geographies.
Larger customer growth demonstrates strength of business model
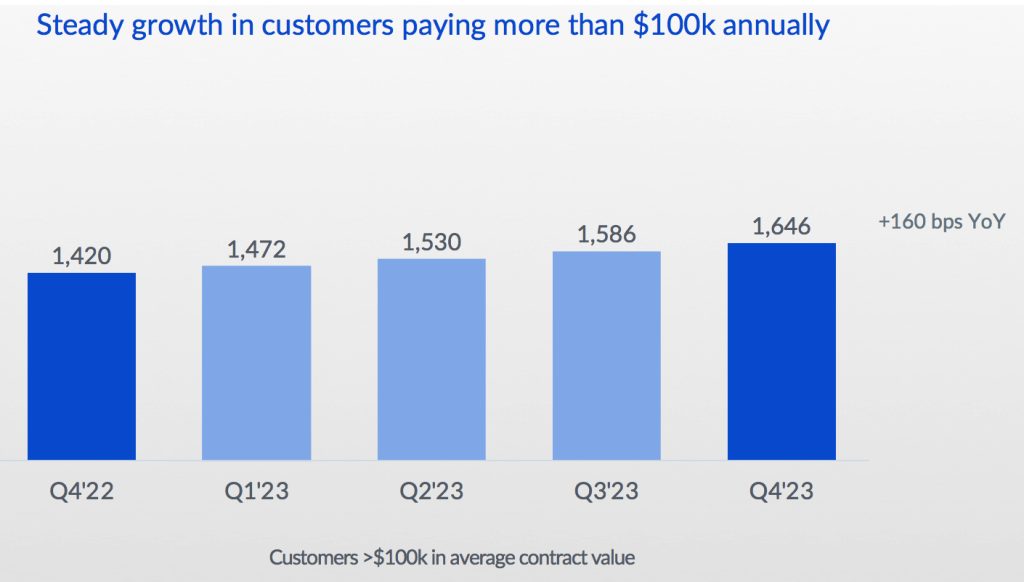
4FQ23 billings of $357 million grew 6% Y/Y or 9% in constant currency. They were partially impacted by the early renewals experienced in the prior quarter and continued scrutiny of larger deals. In 4FQ23, the vendor had approximately 1,650 total customers paying more than $100,000 annually, representing a 16% Y/Y increase. Its suite attach rate was 72% in deals over $100,000 from 65% in 4FQ22. And in 4FQ23, it saw consistent attach rates globally. Suite customers now represent 46% of revenue, up 11 points from 35% a year ago.
As expected 4FQ23 net retention rate was down Y/Y impacted by pressure from customers lower headcount growth and greater budget scrutinity on internal transformation initiatives. In some cases these dynamics impacted customer's IT decisions and priorities across their business and this dynamic included some deals pushing out or deals getting incrementally smaller than anticipated leading also to a softening and billings as firm exited FY23.
In FY23, Box grew its sales force by 15% Y/Y. In FY24, its intend to grow its quota-carrying sales force in the mid-single-digit percentage range with a continued focus on its higher-performing geographies and segments.
In FY23, the firm delivered annual revenue of $991 million up 13% Y/Y or 17% in constant currency and in line with our initial full year guidance ($990 million to $992 million) despite experiencing significantly greater currency and macroeconomic headwinds than initially anticipated.
FY23 also marked its first year of GAAP profitability.
Revenue and net income (loss) in $million
| Period | Revenue | Y/Y growth | Net income (loss) |
| FY11 | 21.1 | NA | (53.3) |
| FY12 | NA | NA | NA |
| FY13 | 58.8 | NA | (112.6) |
| FY14 | 124.2 | 112% | (168.6) |
| FY15 | 216.4 | 74% | (168.2) |
| FY16 | 302.7 | 40% | (202.9) |
| FY17 | 398.6 | 32% | (150.8) |
| FY18 | 506.1 | 27% | (155.0) |
| FY19 | 608.4 | 20% | (134.6) |
| FY20 | 696.2 | 14% | (144.3) |
| 1FQ21 | 183.6 | 13% | 2.6 |
| 2FQ21 | 192.3 | 11% | (7.7) |
| 3FQ21 | 196.0 | 11% | (5.3) |
| 4FQ21 | 198.9 | 8% | (4.9) |
| FY23 | 990.9 | 13% | 26.8 |
| 1FQ24* | 248-250 | 4%-5% | NA |
| FY24* | 1,050-1,060 | 6%-7% | NA |
* Estimations
Note: IPO in 2015 raising $175 million


 Subscribe to our free daily newsletter


