


 Box: Fiscal 1Q23 Financial Results
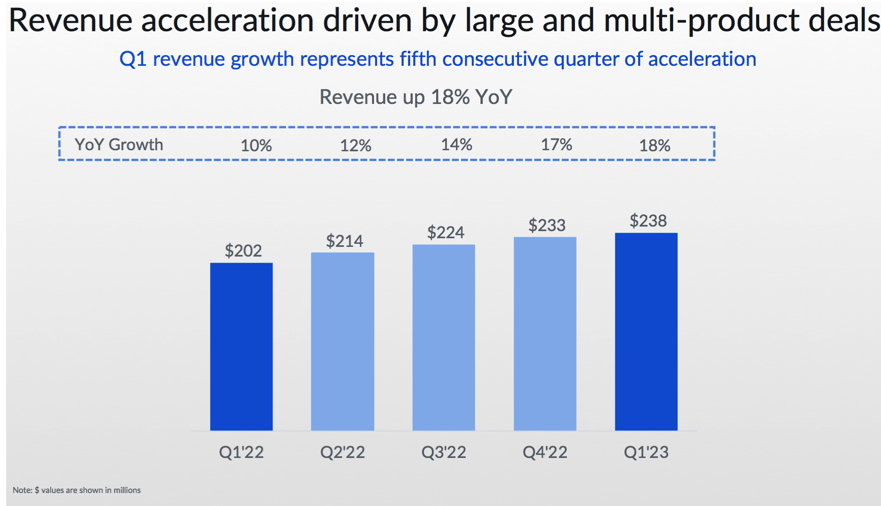
Sales up 2% Q/Q and 18% Y/Y, and never ending net losses
This is a Press Release edited by StorageNewsletter.com on June 1, 2022 at 2:02 pm| (in $ million) | 1Q22 | 1Q23 | Growth |
| Revenue |
202.4 | 238.4 | 18% |
| Net income (loss) | (14.6) | (8.9) |
Box, Inc. announced preliminary financial results for the first quarter of fiscal year 2023, which ended April 30, 2022.
“Our strong first quarter results demonstrate the continued execution of our growth strategy as we execute vs. a $74 billion market opportunity,” said Aaron Levie, co-founder and CEO. “Today, more customers than ever are leveraging our Content Cloud to transform their businesses. Our product strategy is to build on this momentum by adding new capabilities that further expand the value and impact of Box, powering the full lifecycle of content for our customers in a single, secure cloud platform. The announcement in Q1 of Box Canvas, our native real-time visual collaboration and virtual white boarding solution, is the latest example of our innovation and industry leadership as we shape the future of work.”
“We had an excellent start to the year, with a fifth consecutive quarter of accelerating revenue growth,” said Dylan Smith, co-founder and CFO. “Our strong multi-product suites momentum drove a Net Retention Rate of 111%, up 800 basis points from 103% in the year ago period. Despite significant FX headwinds, our underlying business remains strong as we continue to execute on our Content Cloud platform strategy to ensure that we will drive further annual revenue acceleration and continued margin expansion in FY23.“
1FQ23 Financial Highlights
• Revenue was $238.4 million, an 18% increase from revenue for 1FQ22 of $202.4 million. Revenue growth includes a negative impact of 2 percentage points from FX.
• Remaining performance obligations as of April 30, 2022, were $1.0 billion, a 16% increase from remaining performance obligations as of April 30, 2021 of $864.8 million. RPO growth includes a negative impact of 6 percentage points from FX.
• Billings were $172.2 million, an 8% increase from billings for 1FQ22 of $159.4 million. Billings growth includes a negative impact of 9 percentage points from FX.
• GAAP gross profit was $176.2 million, or 73.9% of revenue. This compares to a GAAP gross profit of $141.5 million, or 69.9% of revenue, in 1FQ22. It was $182.0 million, or 76.3% of revenue. This compares to a non-GAAP gross profit of $147.7 million, or 73.0% of revenue, in 1FQ22.
• GAAP operating income was $0.6 million, or 0.3% of revenue. This compares to a GAAP operating loss of $10.3 million, or 5.1% of revenue, in 1FQ22.
• Non-GAAP operating income was $49.2 million, or 20.6% of revenue. This compares to a non-GAAP operating income of $34.4 million, or 17.0% of revenue, in 1FQ22.
• GAAP net loss per share attributable to common stockholders, basic and diluted, 2023 was $0.06 on 144.7 million weighted-average shares outstanding. This compares to a GAAP net loss per share attributable to common stockholders of $0.09 in 1FQ22 on 161.7 million weighted-average shares outstanding. GAAP net loss per share includes a negative impact of 3 cents from FX.
• Non-GAAP net income per share attributable to common stockholders, diluted, was $0.23. This compares to a non-GAAP net income per share attributable to common stockholders, diluted, of $0.18 in 1FQ22. Non-GAAP net loss per share includes a negative impact of 3 cents from FX.
• Net cash provided by operating activities was $107.7 million, a 14% increase from the $94.8 million generated in 1FQ22.
• Free cash flow was $90.9 million, a 20% increase from the $75.9 million generated in 1FQ22.
2FQ23 guidance
• Revenue is expected to be in the range of $244 million to $246 million, up 15% Y/Y at the high-end of the range.
• GAAP operating margin is expected to be approximately 2.5%, and non-GAAP operating margin is expected to be approximately 22%.
• GAAP basic and diluted net loss per share attributable to common stockholders are expected to be in the range of $0.02 to $0.01.
• Non-GAAP diluted net income per share attributable to common stockholders is expected to be in the range of $0.27 to $0.28.
• Weighted-average basic and diluted shares outstanding are expected to be approximately 146 million and 152 million, respectively.
FY23 guidance
• Revenue is expected to be in the range of $992 million to $996 million, up 14% Y/Y at the high-end of the range and represents an acceleration from last year’s growth rate of 13%.
• GAAP operating margin is expected to be approximately 3%, and non-GAAP operating margin is expected to be approximately 22.5%. This represents an increase from Box’s previous guidance provided on March 2, 2022, which was 2% and 22%, respectively.
• GAAP basic and diluted net loss per share attributable to common stockholders are expected to be in the range of $0.05 to $0.01. This represents an improvement from Box’s previous guidance provided on March 2, 2022, which was basic and diluted net loss per share of $0.07 to $0.03.
• Non-GAAP diluted net income per share attributable to common stockholders is expected to be in the range of $1.11 to $1.15. This represents an increase from previous guidance provided on March 2, 2022, which was $1.10 to $1.14.
• Weighted-average basic and diluted shares outstanding are expected to be approximately 147 million and 154 million, respectively.
Comments
Sales for the quarter reached $238.4 million, up 2% Q/Q and 18% Y/Y, more than expected ($233-$235 million), being the 5th consecutive quarter of accelerating growth, with net loss at $8.9 million never stopping since inception of the company but in 1FQ21.
Approximately one-third of revenue is generated outside USA.
In 1FQ23, the firm closed 60 100,000+ deals, of which 73% were suites deals. As customers are increasingly adopting its products with more advanced capabilities, roughly 37% of revenue is now attributable to customers who have purchased suites, a 12% point increase from 25% a year ago.
In 1FQ23, net retention rate was 111%, up from 103% in the prior year, driven by customer expansion rate. And for large deals over $100,000, Box had 60 new deals, and a 73% attach rate of suites, up from a 49% attach rate in 1FQ22. It continue to see healthy attach rates in USA and EMEA with improvements in Japan.
1FQ23 billings of $172 million grew 8% Y/Y. This growth was negatively impacted by an incremental 4% points vs. initial expectations due to currency headwinds. Net retention rate at the end of the quarter was 111%, up 800 basis points from 103% in the prior year. The company continues to see strong customer expansion and a stable annualized full churn rate of 4%. It still expects net retention rate to remain roughly consistent throughout FY23.
In 1FQ23, it delivered cash flow from operations of $108 million, up 14% from the year ago period. It also generated free cash flow of $91 million, a yearly improvement of 20%. It generated record cash flow from operations and free cash flow in 1FQ23, driven by strong collections, including several large payments that it had expected to collect in 2FQ23.
It ended the quarter with $520 million in cash, cash equivalents, restricted cash and short-term investments.
For FY23, the company stated that it will continue to focus on our 3 differentiators of frictionless security and compliance, seamless collaboration and workflow and an open platform that's integrated into every application.
Next quarter sales are expected to be in the range of $244 million to $246 million, up 14% to 15% Y/Y or at the high-end of the range.
FY23 revenue is estimated between $992 million to $996 million, up 13% to 14% from FY22.
Revenue and net income (loss) in $ million
| Period | Revenue | Y/Y growth | Net income (loss) |
| FY11 | 21.1 | NA | (53.3) |
| FY12 | NA | NA | NA |
| FY13 | 58.8 | NA | (112.6) |
| FY14 | 124.2 | 112% | (168.6) |
| FY15 | 216.4 | 74% | (168.2) |
| FY16 | 302.7 | 40% | (202.9) |
| FY17 | 398.6 | 32% | (150.8) |
| FY18 | 506.1 | 27% | (155.0) |
| FY19 | 608.4 | 20% | (134.6) |
| FY20 | 696.2 | 14% | (144.3) |
| 1FQ21 | 183.6 | 13% | 2.6 |
| 2FQ21 | 192.3 | 11% | (7.7) |
| 3FQ21 | 196.0 | 11% | (5.3) |
| 4FQ21 | 198.9 | 8% | (4.9) |
| FY21 | 770.8 | 11% | (43.4) |
| 1FQ22 | 202.4 | 2% | (14.6) |
| 2FQ22 | 214.5 | 11% | (8.7) |
| 3FQ22 | 224.0 | 14% | (13.9) |
| 4FQ22 | 233.4 | 17% | (8.7) |
| FY22 | 874.3 | 13% | (41.5) |
| 1FQ23 | 238.4 | 18% | (8.9) |
| 2FQ23* | 244-246 | 14%-15% | NA |
| FY23* | 992-996 | 13%-14% | NA |
* Estimations
Note: IPO in 2015 raising $175 million


 Subscribe to our free daily newsletter


