


 Box: Fiscal 3Q23 Financial Results
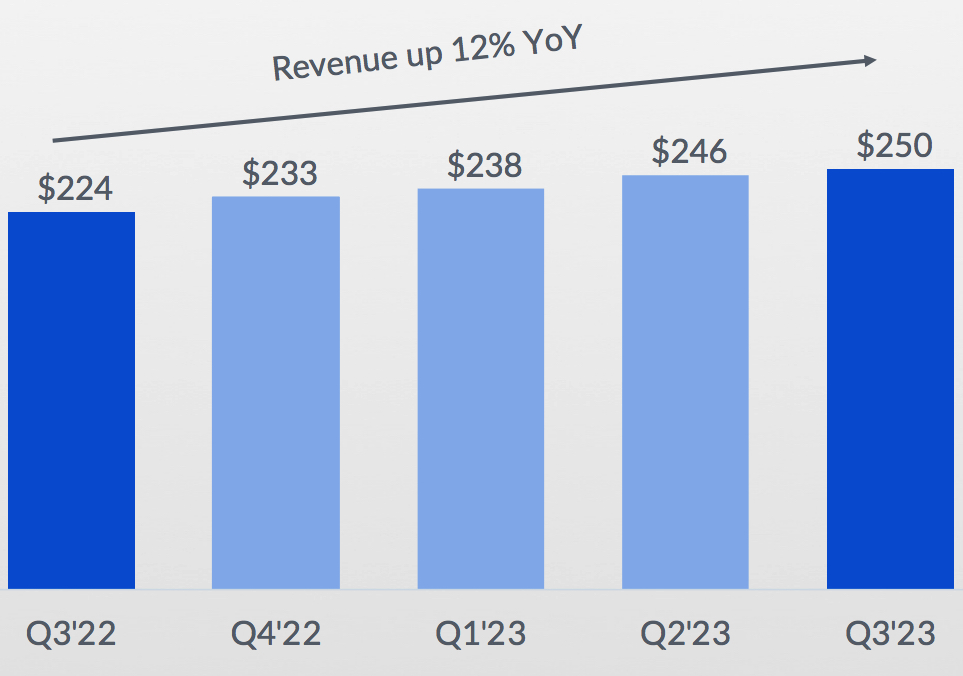
First $1 billion revenue run rate quarter with sales up 12% Y/Y and 2% Q/Q
This is a Press Release edited by StorageNewsletter.com on December 9, 2022 at 2:02 pm| (in $ million) | 3Q22 | 3Q23 | 9 mo. 22 | 9 mo. 23 |
| Revenue | 224.0 | 250.0 | 641.0 | 734.4 |
| Growth | 12% | 15% | ||
| Net income (loss) | (13.9) | 9.9 | (37.1) | 6.3 |
Box, Inc. announced preliminary financial results for the third quarter of fiscal year 2023, which ended October 31, 2022.
“We delivered strong third quarter results with revenue growth of 12% Y/Y and record operating margins,” said Aaron Levie, co-founder and CEO. “As companies prioritize strategic IT initiatives that allow them to efficiently lower IT expenses, the Box Content Cloud enables enterprises to streamline their businesses, drive up productivity, reduce risk, and lower costs. With our industry leading platform, Box is very well-positioned to execute through these dynamic times. As we continue to build an enduring business for the long run, we remain hyper focused on driving growth and even greater profitability.“
“The strength and resiliency of our business model has allowed us to deliver revenue growth while expanding operating and free cash flow margins,” said Dylan Smith, co-founder and CFO. “With operational discipline built into the core of our company, we remain committed to our FY23 operating margin target and to delivering revenue growth plus free cash flow margin of 37%.”
3FQ23 Highlights
- Revenue was $250.0 million, a 12% increase from revenue for 3FQ22 of $224.0 million, or 17% growth on a constant currency basis.
- Remaining performance obligations (RPO) as of October 31, 2022, were $1.056 billion, an 11% increase from remaining performance obligations as of October 31, 2021 of $948.1 million, or 20% growth on a constant currency basis.
- Billings were $258.2 million, a 12% increase from billings for 3FQ22 of $231.5 million, or 20% growth on a constant currency basis.
- GAAP gross profit was $185.5 million, or 74.2% of revenue. This compares to a GAAP gross profit of $161.0 million, or 71.8% of revenue, in 3FQ22.
- Non-GAAP gross profit was $191.2 million, or 76.5% of revenue. This compares to a non-GAAP gross profit of $167.3 million, or 74.7% of revenue, in 3FQ22.
- GAAP operating income was $13.4 million, or 5.3% of revenue. This compares to a GAAP operating loss of $11.1 million, or negative 4.9% of revenue, in 3FQ22.
- Non-GAAP operating income was $60.0 million, or 24.0% of revenue. This compares to a non-GAAP operating income of $46.4 million, or 20.7% of revenue, in 3FQ22.
- GAAP net income per share attributable to common stockholders, basic and diluted, was $0.03 on 142.4 million and 148.1 million weighted-average shares outstanding, respectively. This compares to a GAAP net loss per share attributable to common stockholders, basic and diluted, of $0.12 in v on 151.4 million weighted-average shares outstanding. GAAP net income per share attributable to common stockholders in 3FQ23 includes a negative impact of 6 cents from FX.
- Non-GAAP net income per share attributable to common stockholders, diluted, was $0.31. This compares to a non-GAAP net income per share attributable to common stockholders, diluted, of $0.22 in 3FQ22. Non-GAAP net income per share attributable to common stockholders includes a negative impact of 6 cents from FX.
- Net cash provided by operating activities was $69.7 million, an increase of 51% from net cash provided by operating activities of $46.1 million in 3FQ22.
- Free cash flow was $55.0 million. This compares to free cash flow of $31.2 million in 3FQ22.
4FQ23 Guidance
- Revenue is expected to be in the range of $255 million to $257 million, up 10% Y/Y at the high end of the range, or 15% growth on a constant currency basis.
- GAAP operating margin is expected to be approximately 6.5%, and non-GAAP operating margin is expected to be approximately 24.5%.
- GAAP net income per share attributable to common stockholders is expected to be in the range of $0.06 to $0.07. GAAP EPS guidance includes an expected negative impact from FX of $0.05.
- Non-GAAP diluted net income per share attributable to common stockholders is expected to be in the range of $0.34 to $0.35. Non-GAAP EPS guidance includes an expected negative impact from FX of $0.05.
- Weighted-average basic and diluted shares outstanding are expected to be approximately 144 million and 149 million, respectively.
FY23 Guidance
- Revenue is expected to be in the range of $990 million to $992 million, up 13% Y/Y at the high end of the range, or 17% growth on a constant currency basis.
- GAAP operating margin is expected to be approximately 3.0%, and non-GAAP operating margin is expected to be approximately 22.5%.
- GAAP net income per share attributable to common stockholders is expected to be in the range of $0.02 to $0.03. FY23 GAAP EPS guidance includes an expected negative impact from FX of $0.18.
- Non-GAAP diluted net income per share attributable to common stockholders is expected to be in the range of $1.16 to $1.17. FY23 Non-GAAP EPS guidance includes an expected negative impact from FX of $0.18.
- Weighted-average basic and diluted shares outstanding are expected to be approximately 144 million and 150 million, respectively.
Comments
Revenue of $250 million in 3FQ23 is in line what was expected ($244 million to $246 million) and 17% on a constant currency basis despite the 5% points of FX headwind experienced in the quarter, which was one point higher than what was expected when company set guidance on 3FQ23 call.
Operating margin and EPS were above guidance.
In 3FQ23, Box closed 77 deals worth more than $100,000 annually, vs. 97 in the year ago period. It now has 1,586 total customers paying more than $100,000 annually, representing a 19% Y/Y increase. Win rates remain unchanged, and average price per seat continued to improve Y/Y in 3FQ23.
Revenue growth driven by Suites momentum
The company continued to drive a strong Suites attach rate of 73% of these large deals. Roughly 42% of revenue is now attributable to customers who have purchased Suites, a 11% point increase from 31% a year ago.
Net retention rate at the end of the most recent quarter was 110%, up 100 basis points from the prior year. Annualized full churn rate was 3%, vs. 5% in the prior year, demonstrating stronger product stickiness with customers. In 4FQ23, the firm expects full churn to remain at roughly 3%, and net retention rate to be approximately 108%.
3FQ23 billings of $258 million grew 12% Y/Y, ahead of guidance of a high single digit growth rate. Box drove this better than expected billings outcome despite a 8% point headwind from FX, which was 3 points higher than anticipated in guidance. Strong billings outcome in 3FQ23 was due to increased early renewals and payment durations.
Enterprise Plus comprised over 90% of Suites sales in large deals, and Suites represented 73% of large deals - up from 63% just a year ago.
Outlook
- For 4FQ23, the company anticipates revenue of $255 to $257 million, representing 10% Y/Y growth at the high end of this range. This includes an expected FX impact of approximately 5% points to 4FQ23 revenue growth rate.
- The firm anticipates FY23 revenue to be in the range of $990 million to $992 million ($996 was expected at the end of last quarter), representing 13% Y/Y growth, or 17% on a constant currency basis.
Revenue and net income (loss) in $ million
| Period | Revenue | Y/Y growth | Net income (loss) |
| FY11 | 21.1 | NA | (53.3) |
| FY12 | NA | NA | NA |
| FY13 | 58.8 | NA | (112.6) |
| FY14 | 124.2 | 112% | (168.6) |
| FY15 | 216.4 | 74% | (168.2) |
| FY16 | 302.7 | 40% | (202.9) |
| FY17 | 398.6 | 32% | (150.8) |
| FY18 | 506.1 | 27% | (155.0) |
| FY19 | 608.4 | 20% | (134.6) |
| FY20 | 696.2 | 14% | (144.3) |
| 1FQ21 | 183.6 | 13% | 2.6 |
| 2FQ21 | 192.3 | 11% | (7.7) |
| 3FQ21 | 196.0 | 11% | (5.3) |
| 4FQ21 | 198.9 | 8% | (4.9) |
| FY21 | 770.8 | 11% | (43.4) |
| 1FQ22 | 202.4 | 2% | (14.6) |
| 2FQ22 | 214.5 | 11% | (8.7) |
| 3FQ22 | 224.0 | 14% | (13.9) |
| 4FQ22 | 233.4 | 17% | (8.7) |
| FY22 | 874.3 | 13% | (41.5) |
| 1FQ23 | 238.4 | 18% | (8.9) |
| 2FQ23 | 246.0 | 15% | 1.0 |
| 3FQ23 | 250 | 12% | 9.9 |
| 4FQ23* | 255-257 | 9%-10% | NA |
| FY23* | 990-992 | 13% | NA |
* Estimations
Note: IPO in 2015 raising $175 million


 Subscribe to our free daily newsletter


