


 NetApp: Fiscal 4FQ23 Financial Results
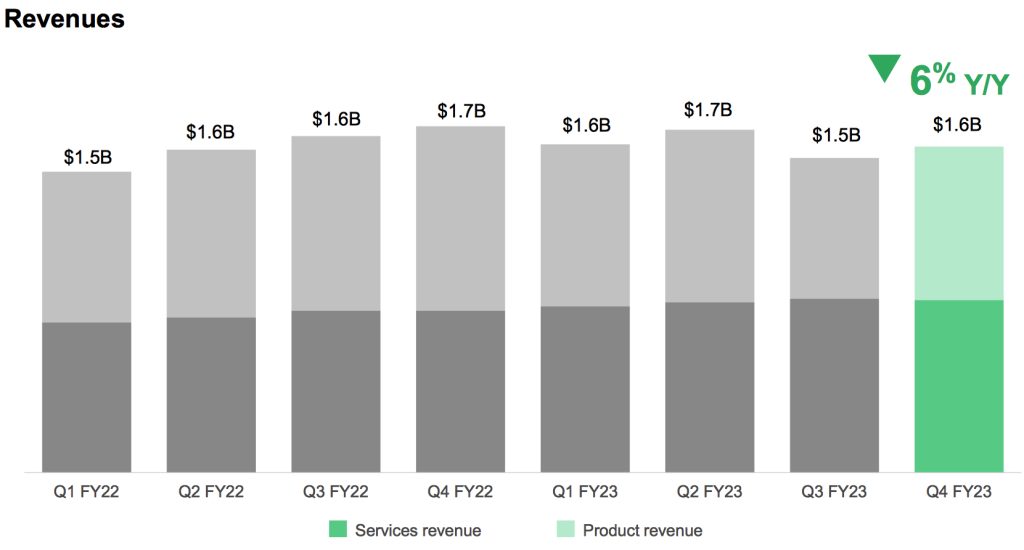
Revenue down 6% with net income growing, next quarter not so good, flat year
This is a Press Release edited by StorageNewsletter.com on June 1, 2023 at 1:03 pm| (in $ million) | 4Q22 | 4Q23 | FY22 | FY23 |
| Revenue | 1,680 | 1,581 | 6,318 | 6,362 |
| Growth | -6% | 1% | ||
| Net income (loss) | 324 | 334 | 1,209 | 1,230 |
NetApp, Inc. reported financial results for the fourth quarter and fiscal year 2023, which ended on April 28, 2023.
“Our sharpened focus and disciplined execution yielded solid Q4 results in a dynamic environment. Digital transformation projects involving business analytics, AI, data security, and application modernization, both on premises and in the cloud, remain top IT priorities,” said George Kurian, CEO. “We deliver significant value to customers on their transformation journeys with a modern approach to hybrid, multicloud infrastructure and data management. We are entering FY24 with substantial new innovations and a more focused operating model to better address the areas of priority spending. I am confident in our ability to drive long-term growth, extend our leadership position, and deliver increasing value for customers, partners, and shareholders.”
4FQ23 financial results
• Net revenue: $1.58 billion, compared to $1.68 billion in 4FQ22; a Y/Y decrease of 6%, or 4% in constant currency.
Hybrid Cloud segment revenue: $1.43 billion, compared to $1.56 billion in 4FQ22
Public Cloud segment revenue: $151 million, compared to $120 million in 4FQ22
• Billings: $1.67 billion, compared to $2.02 billion in 4FQ22; a Y/Y decrease of 17%, or 15% in constant currency.
• Public Cloud annualized revenue run rate (ARR): $620 million, compared to $505 million in 4FQ22; a Y/Y increase of 23%.
• All-flash array ARR: 4 $3.1 billion, compared to $3.2 billion in 4FQ22; a Y/Y decrease of 4%.
• Net income: GAAP net income of $245 million, compared to $259 million in 4FQ22; non-GAAP net income 5 of $334 million, compared to $324 million in 4FQ22. The Y/Y fluctuations in GAAP and Non-GAAP net income each include an unfavorable impact of approximately $18 million from foreign currency exchange rate changes.
• Earnings per share: GAAP net income per share 6 of $1.13 compared to $1.14 in 4FQ22; non-GAAP net income per share of $1.54 compared to $1.42 in 4FQ22. The Y/Y fluctuations in GAAP and Non-GAAP net income per share each include an unfavorable impact of approximately $0.08 from foreign currency exchange rate changes.
• Cash, cash equivalents and investments: $3.07 billion at the end of 4FQ23.
• Cash provided by operations: $235 million, compared to $411 million in 4FQ22.
• Share repurchase and dividends: Returned $256 million to shareholders through share repurchases and cash dividends.
FY23 financial results
• Net revenue: $6.36 billion, compared to $6.32 billion in FY22; a Y/Y increase of 1%, or 4% in constant currency.
Hybrid Cloud segment revenue: $5.79 billion, compared to $5.92 billion in FY22
Public Cloud segment revenue: $575 million, compared to $396 million in FY22
• Billings: $6.41 billion, compared to $6.70 billion in FY22, a Y/Y decrease of 4%, or 1% in constant currency.
• Net income: GAAP net income of $1.27 billion, compared to $937 million in FY22; non-GAAP net income of $1.23 billion, compared to $1.21 billion in FY22. The Y/Y fluctuations in GAAP and Non-GAAP net income each include an unfavorable impact of approximately $126 million from foreign currency exchange rate changes.
• Earnings per share: GAAP net income per share of $5.79 compared to $4.09 in FY22; non-GAAP net income per share of $5.59 compared to $5.28 in FY22. The Y/Y fluctuations in GAAP and non-GAAP net income per share each include an unfavorable impact of approximately $0.57 from foreign currency exchange rate changes.
• Cash provided by operations: $1.11 billion compared to $1.21 billion in FY22.
• Share repurchase and dividends: Returned $1.28 billion to shareholders through share repurchases and cash dividends.
1FQ24 outlook
Net revenues are expected to be in the range of $1.325 billion to $1.475 billion
FY24 outlook
Net revenues are expected to be down Y/Y in the low-to-mid single digits.
Comments
4FQ23 Hybrid Cloud segment revenue of $1.4 billion was down 8% Y/Y and up 4% Q/Q.
Public Cloud ARR of $620 million was up 23% Y/Y and ahead of expectations, driven by strength in Public Cloud storage services. Public Cloud business in 4FQ23 was backend loaded, resulting in softer revenue and lower DBNRR than ARR results would indicate. Public Cloud revenue for 4FQ23 was $151 million and DBNRR was 114%.
The number of total cloud customers, customers using multiple of Public Cloud services, and customers with greater than $500,000 of revenue in the quarter all continue to grow.
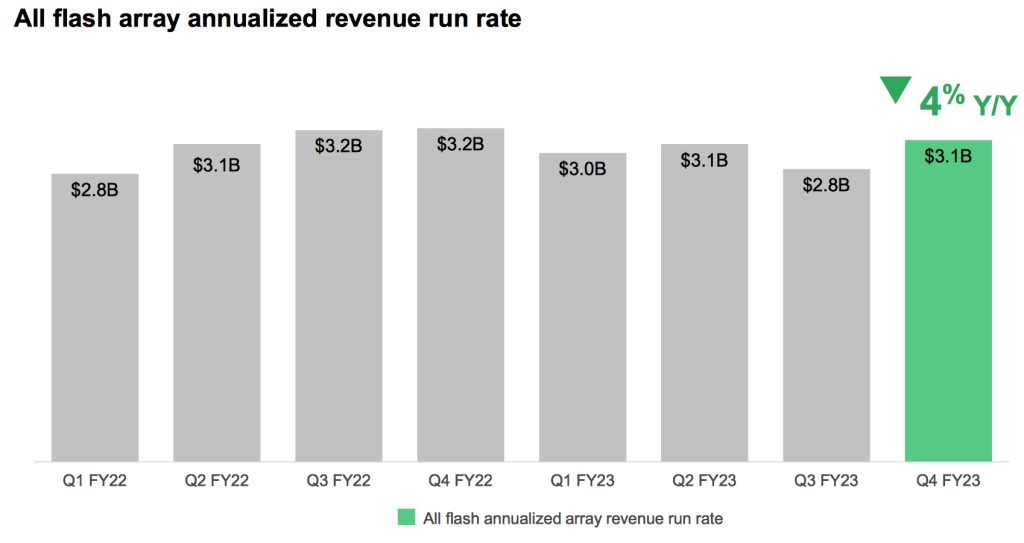
AFA business decreased 4% in 4FQ23 from 4FQ22 to an annualized revenue run rate of $3.1 billion. Similar to 3FQ23, headwinds from large enterprises weighed on product and AFA revenue. The company rebalanced its go-to-market efforts, including focusing its broad sales organization on selling flash through compensation plans and reinstituting a specialist sales team for cloud. It believes these actions will allow the team to better address the large storage TAM. Entering FY24, the firm is confident that these actions will enable to drive product revenue growth and regain share in the AFA market. It is seeing early, positive signs, but the full benefit of these changes will take time to develop and should be a driver for product revenue growth in the second half of the year. To take advantage of record low NAND prices, it has made strategic purchase commitments to lock in pricing for a large portion of its expected FY24 SSD demand.
In conclusion, while FY23 was not the year the company expected at its outset, its disciplined management enabled to overcome a number of headwinds to deliver all-time high operating margin and EPS. The fundamentals of its business model are sound and its confidence in its strategy and the health of long-term opportunity is unchanged.
NetApp's financial results since FY16 in $ million
| Fiscal Period | Revenue | Y/Y Growth | Net income (loss) |
| FY16 | 5,546 | -9% | 229 |
| FY17 | 5,519 | -0% | 509 |
| FY18 | 5,911 | 7% | 75 |
| FY19 |
6,146 | 4% |
1,169 |
| FY20 |
5,412 | -12% |
819 |
| FY21 | 5,744 | 6% | 730 |
| 1Q22 |
1,458 | 12% | 202 |
| 2Q22 |
1,566 | 11% | 292 |
| 3Q22 |
1,614 | 10% | 252 |
| 4Q22 | 1,680 | 8% | 259 |
| FY22 | 6,318 | 10% | 937 |
| 1Q23 |
1,592 | 9% | 214 |
| 2Q23 |
1,663 | 6% | 750 |
| 3Q23 | 1,526 | -5% | 65 |
| 4Q23 | 1,581 | -6% | 334 |
| 1Q24 (estim.) | 1,325-1,475 | -17%-7% | NA |
| FY24 (estim.) | Down | in low-to-mid single digits | NA |


 Subscribe to our free daily newsletter


