


 NetApp: Fiscal 1Q23 Financial Results
Revenue at $1.592 billion, up 9% Y/Y and down 5% Q/Q
This is a Press Release edited by StorageNewsletter.com on August 26, 2022 at 2:04 pm| (in $ million) | 1Q22 | 1Q23 | Growth |
| Revenue |
1,458 | 1,592 | 9% |
| Net income (loss) | 202 | 314 |
1FQ23 highlights:
• Record for billings, revenue, gross profit dollars, operating income, and EPS
• Net revenues grew 9% Y/Y to $1.59 billion, 13% in constant currency
• Product revenue grew 8% Y/Y to $786 million, the 6th consecutive quarter of Y/Y growth
• Billings were $1.56 billion, an increase of 13% Y/Y, 18% in constant currency
• NetApp Public Cloud annualized revenue run rate (ARR) increased 73% Y/Y to $584 million
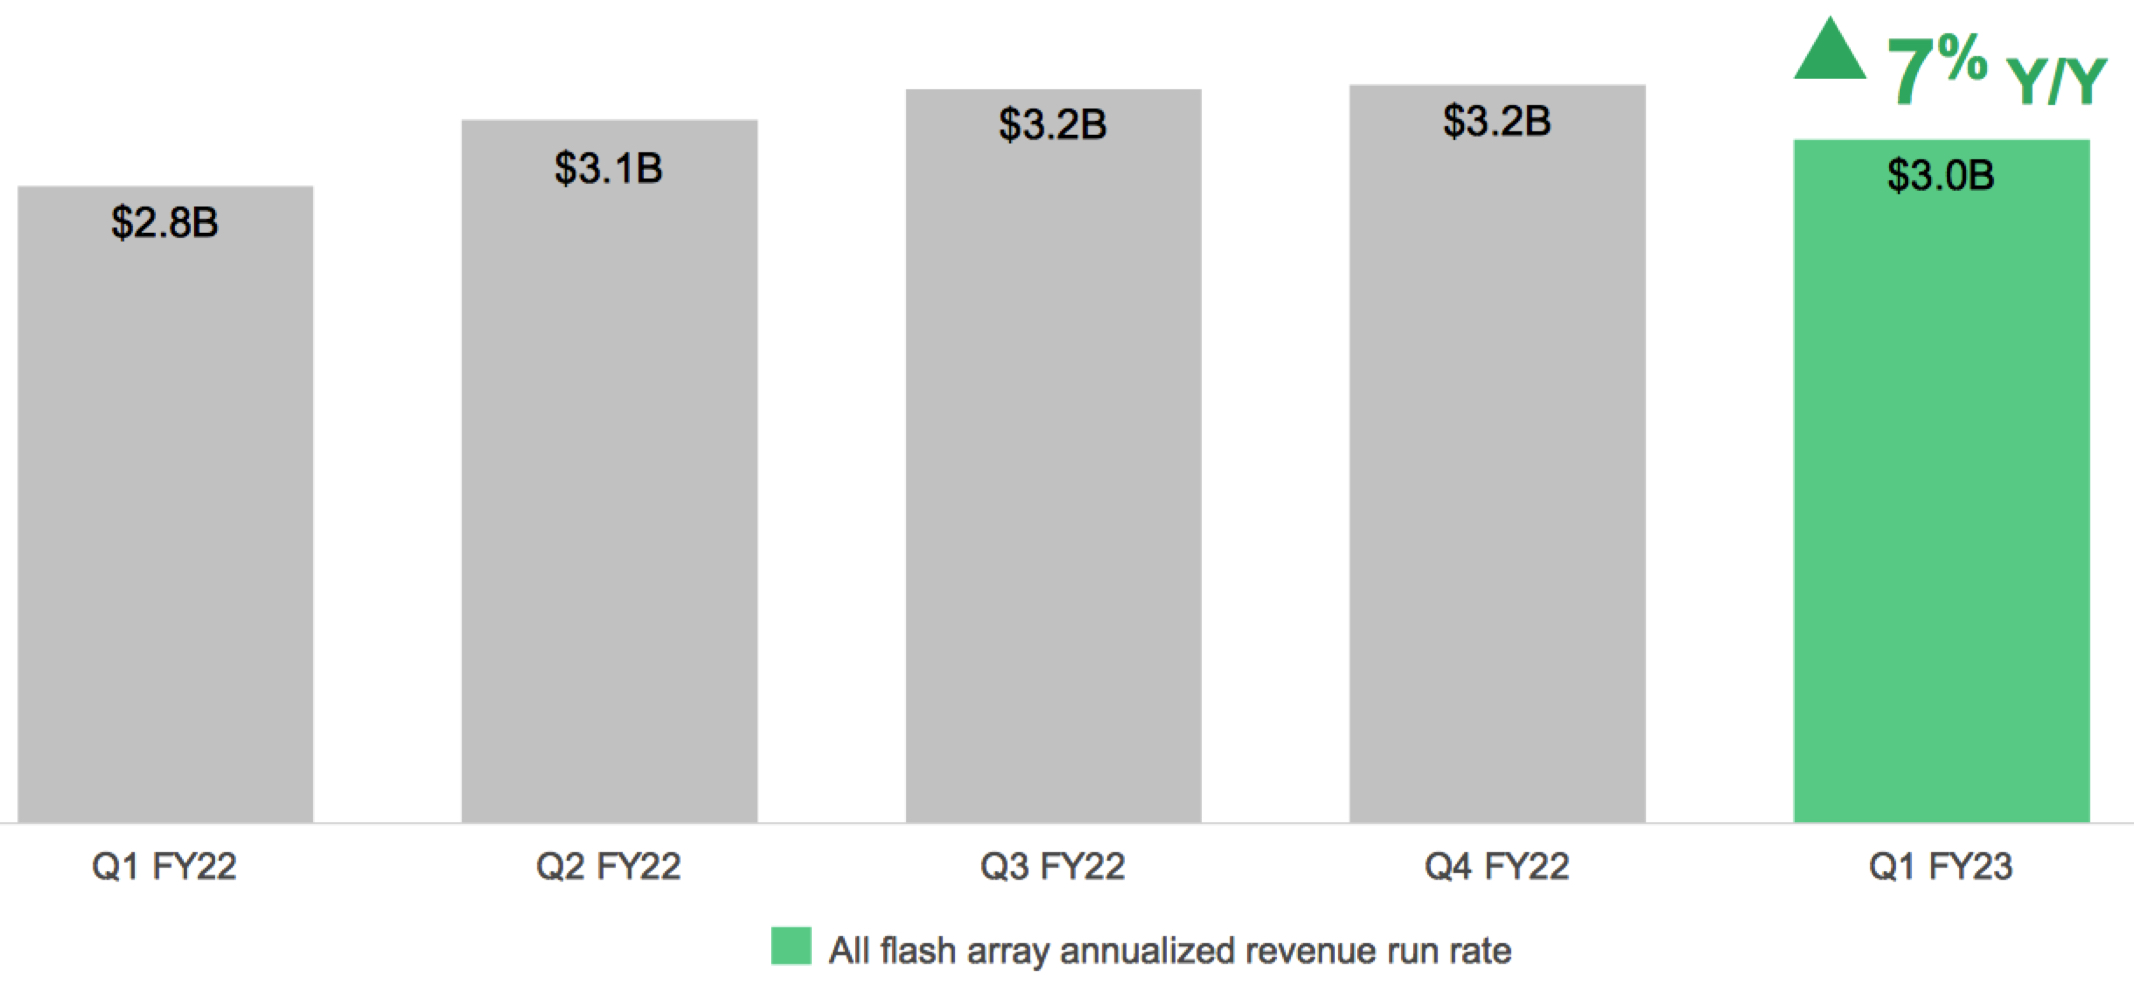
• AFA ARR4 increased 7% Y/Y to $3.0 billion
• $460 million returned to shareholders in share repurchases and cash dividends
NetApp Inc. reported financial results for the first quarter of fiscal year 2023, which ended on July 29, 2022.
“We delivered a great start to the year, fueled by broad-based demand across our portfolio and geographies, setting all-time 1Q company highs for billings, revenue, gross profit dollars, operating income and EPS,” said CEO George Kurian. “Our solutions are aligned with our customer’s top priorities helping them reduce cost, risk and complexity for their digital and cloud transformations. This is evidenced by the strong growth of our revenue, billings and profitability.”
1FQ23 financial results
• Net revenues: $1.59 billion, compared to $1.46 billion in 1FQ22
- Hybrid cloud segment revenue: $1.46 billion, compared to $1.38 billion in 1FQ22
- Public cloud segment revenue: $132 million, compared to $79 million in 1FQ22
• Net income: GAAP net income of $214 million, compared to $202 million in 1FQ22; non-GAAP net income of $269 million, compared to $263 million in 1FQ22
• Earnings per share: GAAP net income per share6 of $0.96, compared to $0.88 in 1FQ22; non-GAAP net income per share of $1.20, compared to $1.15 in 1FQ22
• Cash, cash equivalents and investments: $3.44 billion at the end of 1FQ23
• Cash provided by operations: $281 million, compared to $242 million in 1FQ22
• Share repurchase and dividends: Returned $460 million to shareholders through share repurchases and cash dividends
Financial guidance for 2FQ23:
- Net revenues expected in the range of $1.595 billion to $1.745 billion
- Earnings per share is to be in the range of $0.93-$1.03 (GAAP) and $1.28-$1.38 (non GAAP)
FY23 outlook
- Net revenues expected to grow in the range of 6% to 8%
- Public cloud ARR is expected to exit the fiscal year in the range of $780 million to $820 million
- Consolidated gross margins in the range of 65%-66% (GAAP) and 66%-67% (non-GAAP)
- Operating margins in the range of 18%-19% (GAAP) and 23%-24% (non-GAAP)
- Earnings per share in the range of $4.09-$4.29 (GAAP) and $5.40-$5.60 (non-GAAP)
Dividend
The next cash dividend of $0.50 per share is to be paid on October 26, 2022, to shareholders of record as of the close of business on October 7, 2022.
Comments
Revenue for the quarter came in at $1.592 billion, up 9% Y/Y and down 5% Q/Q. Adjusting for the 4-point headwind from Fx, billings and revenue would have been up 18% and 13% Y/Y, respectively. Three month ago, NetApp was expected $1,475 to 1,625 million.
Segment revenue and gross margin
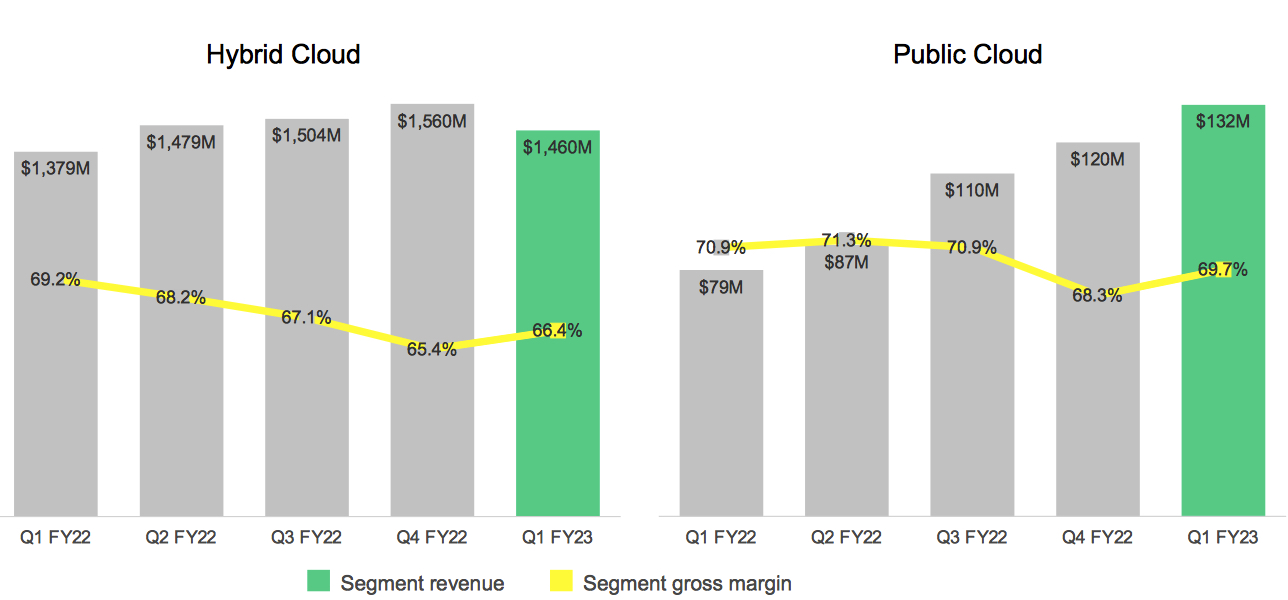
In 1FQ23, the company continued to see strong demand for Public Cloud services. Public Cloud ARR grew 73% Y/Y at $584 million, exiting the quarter at $584 million. Public Cloud segment revenue grew 67% Y/Y. Public Cloud ARR exited 1FQ23 at $584 million, up 73% Y/Y, driven by strength in Cloud Storage services, led by Azure NetApp Files, AWS FSx for Ontap and Google CVS. Public Cloud revenue recognized in the quarter was $132 million, up 67% Y/Y and 10% Q/Q. Recurring support and Public Cloud revenue of $730 million was up 11% Y/Y, constituting 46% of total revenue - a new record for NetApp.
Storage services constitute approximately 60% of Public Cloud ARR.
In 1FQ23, Hybrid Cloud revenue grew 6% Y/Y at $1.46 billion, driven by solid product revenue growth of 8%. AFA annualized revenue run rate grew 7% Y/Y to $3.0 billion. All-flash penetration of installed base grew to 32% of installed systems. FAS hybrid arrays again posted strong unit growth.
AFA annualized revenue run rate
Product revenue of $786 million increased 8% Y/Y. Consistent with growth in FY22, software product revenue of $476 million increased 15% Y/Y, driven by the value of Ontap software and data services. Total 1FQ23 recurring support revenue of $598 million increased 3% Y/Y, highlighting the health of firm's installed base.
NetApp ended 1FQ23 with $4.2 billion in deferred revenue, an increase of 7% Y/Y. This quarter marks the 18th consecutive quarter of Y/Y deferred revenue growth, which is a leading indicator for recurring revenue growth.
Expectation for 2FQ23 in sales is between $1,595 and $1,745 million or between 2% and 11% Y/Y.
For FY23, net revenue is expected to grow in the range of 6% to 8% or between $6,697 and $6,823 million.
NetApp's financial results since FY2016
| Fiscal Period | Revenue | Y/Y Growth | Net income (loss) |
| FY16 | 5,546 | -9% | 229 |
| FY17 | 5,519 | -0% | 509 |
| FY18 | 5,911 | 7% | 75 |
| FY19 |
6,146 | 4% |
1,169 |
| 1Q20 |
1,236 | -16% | 103 |
| 2Q20 |
1,371 | -10% | 243 |
| 3Q20 |
1,404 | -10% | 277 |
| 4Q20 |
1,401 | -12% | 196 |
| FY20 |
5,412 | -12% |
819 |
| 1Q21 |
1,303 | 5% | 77 |
| 2Q21 |
1,416 | 3% | 137 |
| 3Q21 |
1,470 | 5% | 182 |
| 4Q21 |
1,555 | 11% | 344 |
| FY21 | 5,744 | 6% | 730 |
| 1Q22 |
1,458 | 12% | 202 |
| 2Q22 |
1,566 | 11% | 292 |
| 3Q22 |
1,614 | 10% | 252 |
| 4Q22 | 1,680 | 8% | 259 |
| FY22 | 6,318 | 10% | 937 |
| 1Q23 |
1,592 | 9% | 214 |
| 2Q23* |
1,595- 1,745 | 2%- 11% | NA |
| FY23* |
6,697-6,823 |
6%-8% | NA |
Revenue and net income (loss) in $ million
* Outlook


 Subscribe to our free daily newsletter


