


 NetApp: Fiscal 3FQ23 Financial Results
Revenue down (5%) Y/Y for first time since 1FQ21 and net diminishing
This is a Press Release edited by StorageNewsletter.com on February 23, 2023 at 2:02 pm| (in $ million) | 3Q22 | 3Q23 | 9 mo. 22 | 9 mo. 23 |
| Revenue | 1,614 | 1,526 | 4,638 | 4,781 |
| Growth | -5% | 3% | ||
| Net income (loss) | 252 | 65 | 679 | 1,029 |
NetApp, Inc. reported financial results for the third quarter of fiscal year 2023, which ended on January 27, 2023.
“In 3Q, we executed well on the elements under our control in the face of a weakening IT spending environment and continued cloud cost optimization,” said George Kurian, CEO. “We are confident that we remain well positioned to take advantage of the secular growth trends of data-driven digital and cloud transformations. Building on that solid foundation, we are sharpening our execution to accelerate near-term results while strengthening our position when the spending environment rebounds.”
3FQ23 financial results
- Net revenue: $1.53 billion, compared to $1.61 billion in 3FQ22; a Y/Y decrease of 5%, or 2% in constant currency.
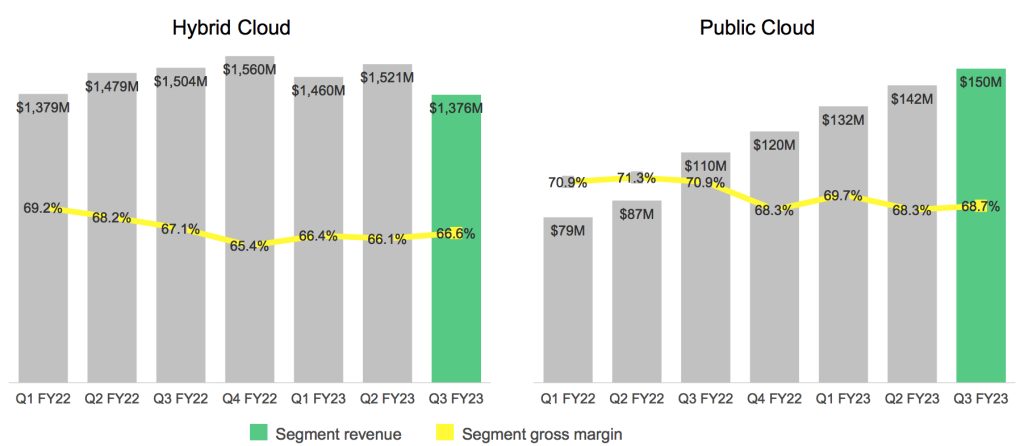
- Hybrid Cloud segment revenue: $1.38 billion, compared to $1.50 billion in 3FQ22.
- Public Cloud segment revenue: $150 million, compared to $110 million in 3FQ22.
- Billings: $1.57 billion, compared to $1.76 billion in 3FQ22; a Y/Y decrease of 11%, or 7% in constant currency.
- Public Cloud annualized revenue run rate (ARR) $605 million, compared to $469 million in 3FQ22; a Y/Y increase of 29%.
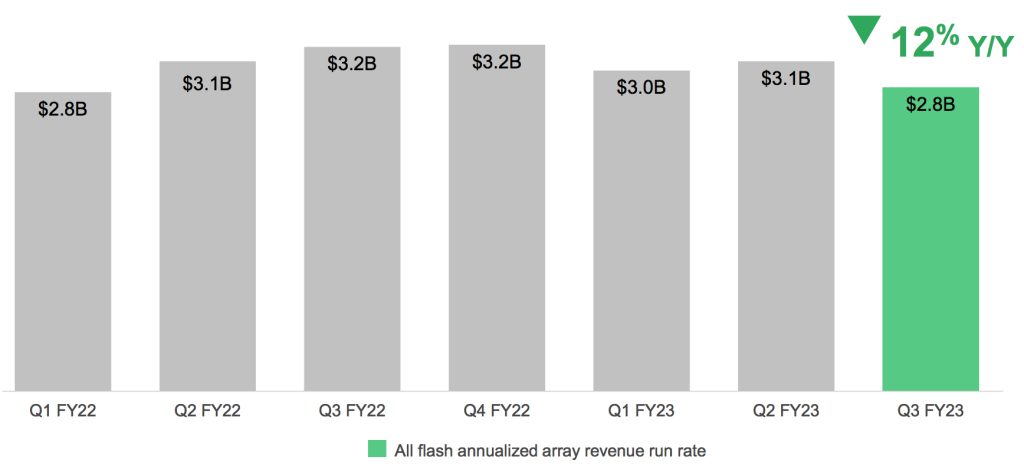
- All-flash array ARR $2.8 billion, compared to $3.2 billion in 3FQ22; a Y/Y decrease of 12%.
- Net income: GAAP net income of $65 million, compared to $252 million in 3FQ22; non-GAAP net income of $301 million, compared to $330 million in 3FQ22. The Y/Y fluctuations in GAAP and Non-GAAP net income each include an unfavorable impact of approximately $30 million from foreign currency exchange rate changes.
- Earnings per share: GAAP net income per share of $0.30, compared to $1.10 in 3FQ22; non-GAAP net income per share of $1.37, compared to $1.44 in 3FQ22. The Y/Y fluctuations in GAAP and non-GAAP net income per share each include an unfavorable impact of approximately $0.14 from foreign currency exchange rate changes.
- Cash, cash equivalents and investments: $3.1 billion at the end of 3FQ23.
- Cash provided by operations: $377 million, compared to $260 million in 3FQ22.
- Share repurchase and dividends: Returned $308 million to shareholders through share repurchases and cash dividends.
Financial outlook
- Net revenues in 3FQ23 are expected to be in the range of $1.475 billion to $1.625 billion
- Net revenues are expected to be flat year-over-year in FY23
The next cash dividend of $0.50 per share is to be paid on April 26, 2023, to shareholders of record as of the close of business on April 6, 2023.
Comments
The company recorded revenue of $1,526 million, down 5% Y/Y and 8% Q/Q, at the low end of guidance ($1,525 million to $1,675 million). It is decreasing yearly for first time since 1FQ21, and net diminishing
It continued to see increased budget scrutiny, requiring higher level approvals, which resulted in smaller deal sizes, longer selling cycles, and some deals pushing out. It is feeling this most acutely in large enterprise and the Americas tech and service provider sectors. Customers are looking to stretch their budget dollars, sweating assets, shifting spend to hybrid flash and capacity flash arrays from higher-cost performance flash arrays and, as its cloud partners have described, optimizing cloud spending.
Segment revenue and gross margin
AFA annualized revenue run rate
At the start of 4FQ22, the firm implemented a workforce reduction of 8%.
It expects 4FQ23 revenue to range between $1.475 billion and $1.625 billion which, at the midpoint, implies an 8% decrease Y/Y, or a 6% decrease in constant currency. In this macro environment, it expects customers to continue to optimize their cloud spend at its 3 major hyperscaler partners. As a result, it expect Cloud revenue and ARR to be approximately flat sequentially in 4FQ23.
Net revenue are expected to be flat Y/Y in FY23 but no figures were revealed. During former quarter, it was announced to be between $6,444 million and 6,065 million or +2% to -4% Y/Y.
NetApp's financial results since FY16 in $ million
| Fiscal Period | Revenue | Y/Y Growth | Net income (loss) |
| FY16 | 5,546 | -9% | 229 |
| FY17 | 5,519 | -0% | 509 |
| FY18 | 5,911 | 7% | 75 |
| FY19 |
6,146 | 4% |
1,169 |
| FY20 |
5,412 | -12% |
819 |
| 1Q21 |
1,303 | 5% | 77 |
| 2Q21 |
1,416 | 3% | 137 |
| 3Q21 |
1,470 | 5% | 182 |
| 4Q21 |
1,555 | 11% | 344 |
| FY21 | 5,744 | 6% | 730 |
| 1Q22 |
1,458 | 12% | 202 |
| 2Q22 |
1,566 | 11% | 292 |
| 3Q22 |
1,614 | 10% | 252 |
| 4Q22 | 1,680 | 8% | 259 |
| FY22 | 6,318 | 10% | 937 |
| 1Q23 |
1,592 | 9% | 214 |
| 2Q23 |
1,663 | 6% | 750 |
|
3Q23 |
1,526 | -5% | 65 |
|
4Q23 (estim.) |
1,475-1,625 | -9% - -3% | NA |
| FY23 (estim.) |
Flat | NA |


 Subscribe to our free daily newsletter


