


 NetApp: Fiscal 2FQ23 Financial Results
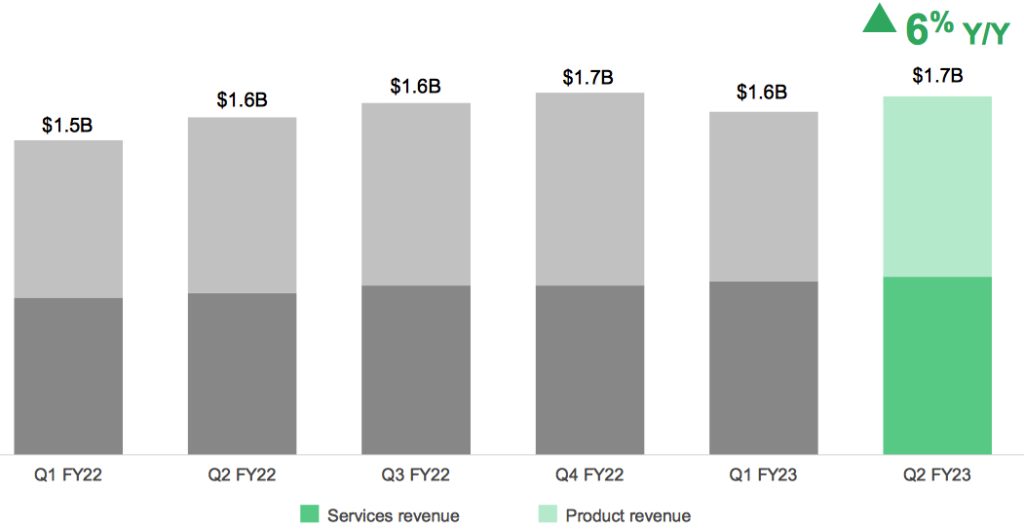
Highest historical quarterly revenue at $1,663 million since $1,680 million in 4FQ22
This is a Press Release edited by StorageNewsletter.com on November 30, 2022 at 2:02 pm| (in $ million) | 2Q22 | 2Q23 | 6 mo. 22 | 6 mo. 23 |
| Revenue | 1,556 | 1,663 | 3,024 | 3,255 |
| Growth | 6% | 8% | ||
| Net income (loss) | 224 | 750 | 426 | 964 |
Delivers all time 2FQ company highs for revenue, billings, gross profit dollars, operating income and EPS
• Net revenues for 2FQ23 grew 6% Y/Y to $1.66 billion, 12% in constant currency
• 2FQ23 product revenue grew 3% Y/Y to $837 million, the 7th consecutive quarter of Y/Y growth
• 3FQ23 billings were $1.60 billion, an increase of 3% Y/Y, 9% in constant currency
• Public Cloud annualized revenue run rate (ARR) increased 55% Y/Y to $603 million
• AFA ARR increased 2% Y/Y to $3.1 billion
• $258 million returned to shareholders in share repurchases and cash dividends in the second quarter
NetApp, Inc. reported financial results for the second quarter of fiscal year 2023, which ended on October 28, 2022.
“We delivered a solid quarter in a dynamic environment, with all-time highs for 2Q revenue, billings, gross profit dollars, operating income, and EPS,” said George Kurian. “Our modern approach to the hybrid multicloud delivers significant value to our customers and creates sizeable opportunity for us. In a challenging macro environment, we remain focused on innovation, execution, and operational discipline.“
2FQ23 financial results
- •Net revenues: $1.66 billion, compared to $1.57 billion in 2FQ22
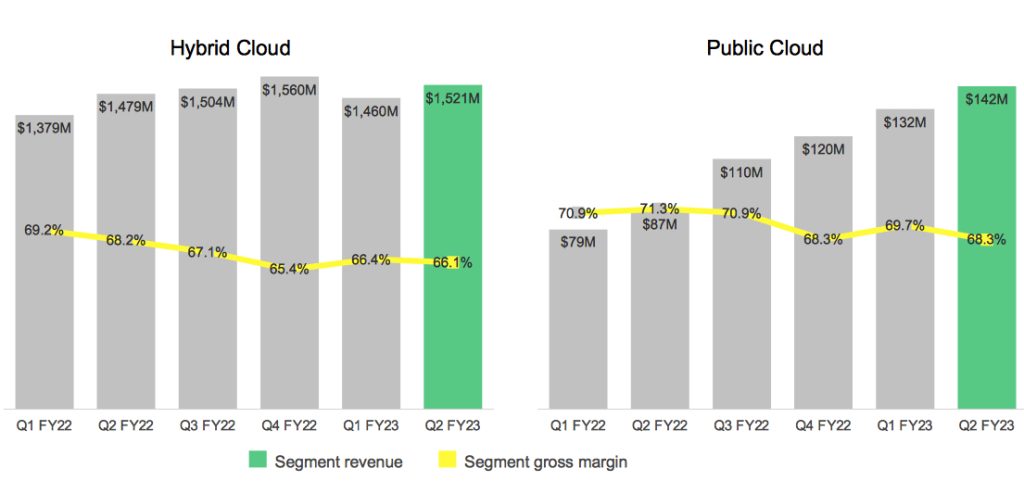
- Hybrid Cloud segment revenue: $1.52 billion, compared to $1.48 billion in 2FQ22.
- Public Cloud segment revenue: $142 million, compared to $87 million in 2FQ22.
- Net income: GAAP net income of $750 million, compared to $224 million in 2FQ22; non-GAAP net income5 of $326 million, compared to $292 million in 2FQ22. The Y/Y fluctuations in GAAP and non-GAAP net income each include an unfavorable impact of approximately $47 million from foreign currency exchange rate changes.
- Earnings per share: GAAP net income per share6 of $3.41, compared to $0.98 in 2FQ22; non-GAAP net income per share of $1.48, compared to $1.28 in 2FQ22. The Y/Y fluctuations in GAAP and non-GAAP net income per share each include an unfavorable impact of approximately $0.21 from foreign currency exchange rate changes.
- Cash, cash equivalents and investments: $3.03 billion at the end of 2FQ3.
- Cash provided by operations: $214 million, compared to $298 million in the second quarter of fiscal year 2022.
- Share repurchase and dividends: Returned $258 million to shareholders through share repurchases and cash dividends.
The next cash dividend of $0.50 per share is to be paid on January 25, 2023, to shareholders of record as of the close of business on January 6, 2023.
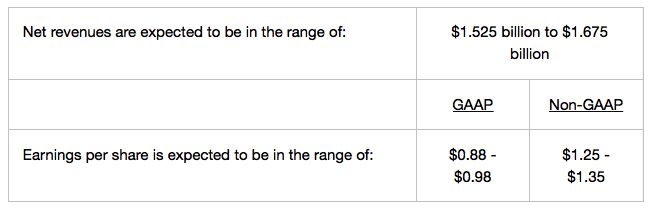
3FQ22 outlook
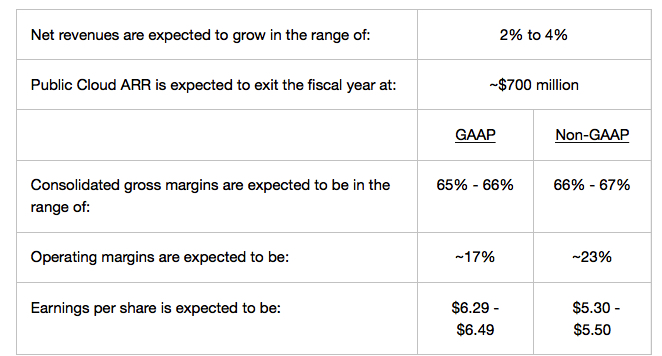
FY23 outloook
Comments
The company recorded highest quarterly revenue at $1,663 million since $1,680 million in 4FQ22, vs. $1.592 billion in 1FQ23, up 9% Y/Y and down 5% Q/Q. At the end of 1FQ23, it was expected in the range of $1.595 billion to $1.745 billion.
Revenue
Kurian commented: "We delivered a good quarter in a dynamic environment. However, we are disappointed with the deceleration of growth in our cloud services. Our conviction in the cloud opportunity and our ability to execute against it is unwavering."
Revenue by segment
The number of customers with greater than $1 million in ARR has more than doubled from 1Q last year.
2FQ23 public cloud segment revenue increased 63% Y/Y to $142 million and dollar-based net revenue retention rate remained healthy at 140%. However, public cloud ARR of $603 million fell short of expectations.
AFA annualized revenue rate
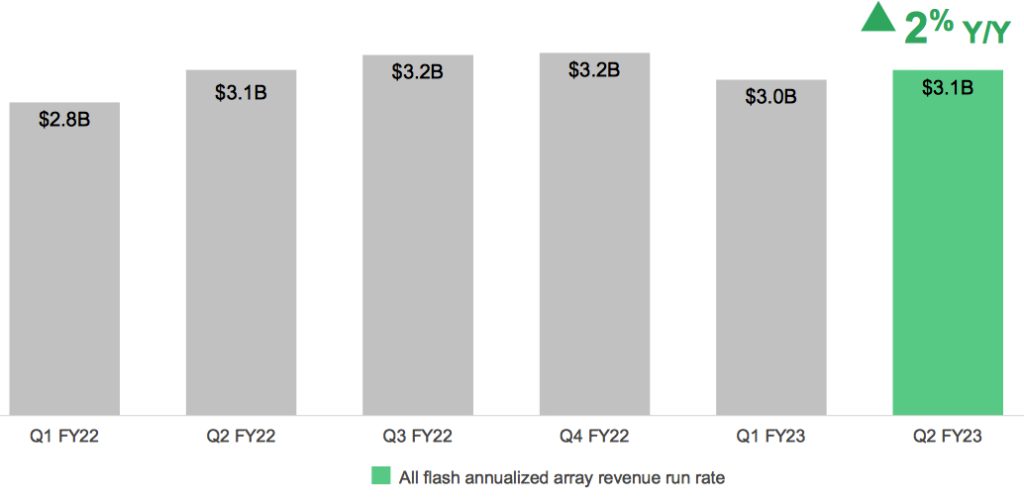
AFA installed base grew to 33% of installed systems. Lower cost, capacity-oriented AFAs and FAS hybrid flash arrays both performed well.
However, current economic realities and unprecedented Fx headwinds are and will continue to impact IT spending, causing the firm to temper its revenue expectations for 2FH23.
3FQ23 guidance is announced only between $1,525 million and $1,675 million or -3% to 7%.
FY23 guidance is supposed to be between $6,444 million and 6,065 million or +2% to -4% Y/Y, 3 months ago it was 6%-8% or between $6,697 and $6,823 million.
NetApp's financial results since FY16 in $ million
| Fiscal Period | Revenue | Y/Y Growth | Net income (loss) |
| FY16 | 5,546 | -9% | 229 |
| FY17 | 5,519 | -0% | 509 |
| FY18 | 5,911 | 7% | 75 |
| FY19 |
6,146 | 4% |
1,169 |
| 1Q20 |
1,236 | -16% | 103 |
| 2Q20 |
1,371 | -10% | 243 |
| 3Q20 |
1,404 | -10% | 277 |
| 4Q20 |
1,401 | -12% | 196 |
| FY20 |
5,412 | -12% |
819 |
| 1Q21 |
1,303 | 5% | 77 |
| 2Q21 |
1,416 | 3% | 137 |
| 3Q21 |
1,470 | 5% | 182 |
| 4Q21 |
1,555 | 11% | 344 |
| FY21 | 5,744 | 6% | 730 |
| 1Q22 |
1,458 | 12% | 202 |
| 2Q22 |
1,566 | 11% | 292 |
| 3Q22 |
1,614 | 10% | 252 |
| 4Q22 | 1,680 | 8% | 259 |
| FY22 | 6,318 | 10% | 937 |
| 1Q23 |
1,592 | 9% | 214 |
| 2Q23 |
1,663 | 6% | 750 |
| 3Q23 (estim.) |
1,525-1,675 | -3% 7% | NA |
| FY23 (estim.) |
6,444-6,065 |
2% -4% | NA |


 Subscribe to our free daily newsletter


