


 Quantum: Fiscal 4Q22 Financial Results
Revenue increased 3.0% Y/Y to $95.2 million, flat Q/Q, and net loss without interruption since 9 quarters
This is a Press Release edited by StorageNewsletter.com on June 13, 2022 at 2:02 pm| (in $ million) | 4Q21 | 4Q22 | FY21 | FY22 |
| Revenue | 92.4 | 95.2 | 349.6 | 372.8 |
| Growth | 3% | 7% | ||
| Net income (loss) | (17.5) | (7.8) | (35.5) | (32.3) |
Quantum Corporation announced financial results for its fiscal fourth quarter and fiscal year 2022 ended March 31, 2022.
4QF22 Financial Summary and Recent Highlights
- Revenue increased 3.0% Y/Y to $95.2 million
- Backlog remained near record level of over $60 million
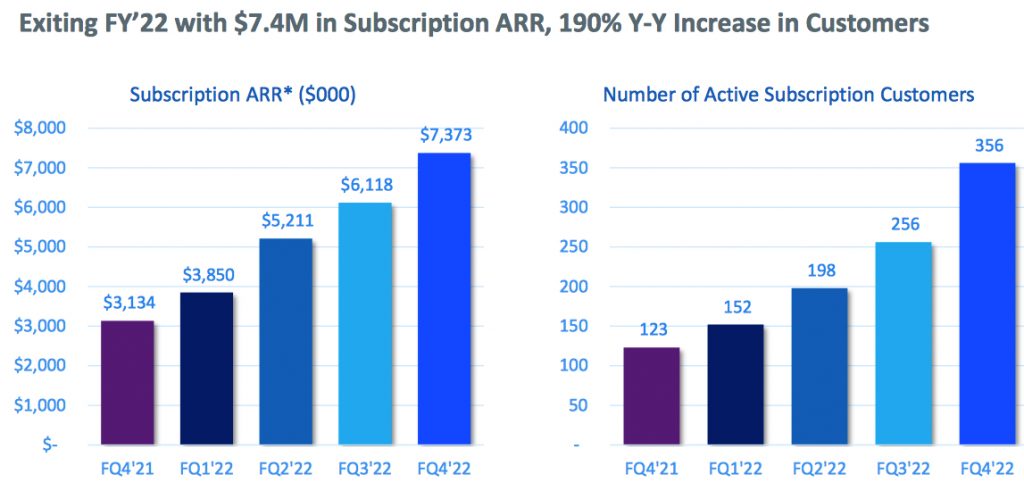
- Number of active subscription customers grew 39% sequentially and 190% Y/Y to 356
- Gross margin increased 110 basis points sequentially to 38.0%
- GAAP net loss was $7.8 million, or ($0.13) per share, improving sequentially and Y/Y
- Adjusted non-GAAP net loss was $2.8 million, or ($0.05) per share, achieving the high-end of guidance
- Adjusted EBITDA of $0.4 million, which was above the midpoint of guidance
- Strengthened balance sheet with oversubscribed rights offering, generating gross proceeds of $67.5 million, reducing outstanding debt and resetting all debt covenants to more favorable levels
“We made progressive improvements throughout the year to strengthen our business, highlighted by revenue for the fourth quarter exceeding our preliminary results,” stated Jamie Lerner, chairman and CEO. “Additionally, we continue to gain increasing momentum transitioning new and existing customers to our software subscription model as demonstrated by $7.4 million of subscription software ARR and $160.5 million in high-value recurring revenue exiting the year.
“We have strengthened our balance sheet with the recent completion of an oversubscribed rights offering that enabled us to reduce debt, increase our cash position and reset all debt covenants to more favorable levels. With backlog at near record levels, we have aggressively implemented supply chain strategies that will help us increase our revenue and margins. We are also implementing a series of cost reduction programs that are focused on reduced spending and continued integration efforts related to the recent acquisitions, which we expect will decrease our current operating expense run-rate by $1.5 to $2.0 million per quarter by the second half of FY23.
“Our focus going forward is to drive improvement in adjusted EBITDA and expand earnings over the next 4 quarters through a combination of operational expense reductions, sales growth and margin expansion, and continued supply chain execution and cost management.“
4FQ22 vs. 3FQ22
- Revenue for 4FQ22 was $95.2 million compared to $95.3 million in 3FQ22. Gross profit in 4FQ22 was $36.2 million, or 38% of revenue, compared to $35.2 million, or 37% of revenue, in 3FQ22.
- Total GAAP operating expenses in 4FQ22 were $41.8 million, or 44% of revenue, compared to $42.4 million, or 45% of revenue, in 3FQ22.
- Selling, general and administrative expenses were $28.3 million in 4FQ22, compared to $27.3 million in 3FQ22. R&D expenses were $13.5 million in 4FQ22, compared to $14.6 million in 3FQ22.
- Non-GAAP operating expenses in 4FQ22 were $37.2 million, compared to $36.3 million in 3FQ22.
- GAAP net loss in 4FQ22 was $7.8 million, or ($0.13) per share, compared to a net loss of $11.1 million, or ($0.19) per share, in 3FQ22.
- Excluding stock compensation, restructuring charges and other non-recurring costs, non-GAAP adjusted loss in 4FQ22 was $2.8 million, or ($0.05) per share, compared to adjusted net loss of $4.6 million, or ($0.08) per share, in 3FQ22.
- Adjusted EBITDA in 4FQ22 was $0.4 million, compared to $0.8 million in 3FQ22.
FY22 vs. FY21
- Revenue of $372.8 million for FY22 increased 6.7% Y/Y primarily driven by strong demand from hyperscale customers and expanded subscription software business.
- Gross profit in FY22 was $147.0 million, or 39.4% of revenue, compared to $150.8 million, or 43.1% of revenue, in FY21.
- Total GAAP operating expenses in FY22 were $160.9 million, or 43.1% of revenue, compared to $142.4 million, or 40.7% of revenue, in FY21. The increase in FY22 operating expenses primarily reflected the addition of costs associated with the company’s recent acquisitions.
- Selling, general and administrative expenses were $108.2 million in FY22, compared to $96.9 million in FY21. R&D expenses were $51.8 million in FY22, compared to $41.7 million in FY21.
- Non-GAAP operating expenses in FY22 were $142.2 million, compared to $127.3 million in FY21.
- GAAP net loss in FY22 was $32.3 million, or ($0.55) per share, compared to a net loss of $35.5 million, or ($0.83) per share, in FY21.
- Excluding stock compensation, restructuring charges and other non-recurring costs, non-GAAP adjusted net loss in FY22 increased to $7.2 million, or ($0.12) per share, compared to an adjusted net loss of $4.9 million, or ($0.11) per share, in FY21.
- Adjusted EBITDA in FY22 decreased to $11.8 million, compared to $28.0 million in FY21. The Y/Y decrease was driven by the impact of higher costs on gross margin associated with supply constraints, combined with the previously referenced increase in operating expenses.
Balance Sheet and Liquidity
- Cash and cash equivalents including restricted cash was $5.5 million as of March 31, 2022, compared to $33.1 million as of March 31, 2021.
- Subsequent to the quarter end, the company closed a rights offering with gross proceeds of $67.5 million, a significant portion of which was allocated to increasing current cash balance.
- Outstanding long-term debt as of March 31, 2022 was $111.6 million, net of $4.9 million in unamortized debt issuance costs. This compares to $92.7 million of outstanding debt as of March 31, 2021, net of $9.7 million in unamortized debt issuance costs.
- Subsequent to the quarter end, the company used proceeds from the rights offering to pay down $20.0 million of outstanding long-term debt.
- Total interest expense was $2.5 million and $11.9 million for the 3 and 12 months ended March 31, 2022, respectively.
Outlook for 1FQ23
- Revenues of $94 million, ± $3 million
- Non-GAAP adjusted net loss of ($3 million), ± $1 million
- Non-GAAP adjusted net loss per share of ($0.04), ± $0.01
- Adjusted EBITDA of breakeven, ± $1 million
Comments
4FQ22 revenue of $95.2 million exceeds preliminary results, up 3% Y/Y, but about the same amount ($95.3 millon) was recorded in 3FQ22.
Backlog decreased slightly to $60 million compared to $62 million last quarter as the firm continues to be supply constrained, primarily on tape drives as well as broad-based shortages of components for servers, network cards and circuit boards. Approximately $32 million of orders in the ending backlog could have shipped to customers if the quarter if the firm would have had supply. This is an increase of $6 million from the prior quarter. Similar to last quarter, approximately $50 million of the ending backlog represented tape products for which the majority was orders from hyperscale customers.
FY22 revenue, although up 7% than the prior year, at $372.8 million, was lower than expected, primarily driven by supply chain constraints seen by much of the industry as well as the lack of a recovery for company U.S. federal business. Gross margins were under pressure by unprecedented component - prices and supply chain logistic cost increases and to a lesser extent, a less favorable product revenue mix. And finally, operating expenses increased primarily due to the integration of the operations from recently acquired businesses. These factors contributed to a weaker than expected operating result and significantly lower EBITDA.
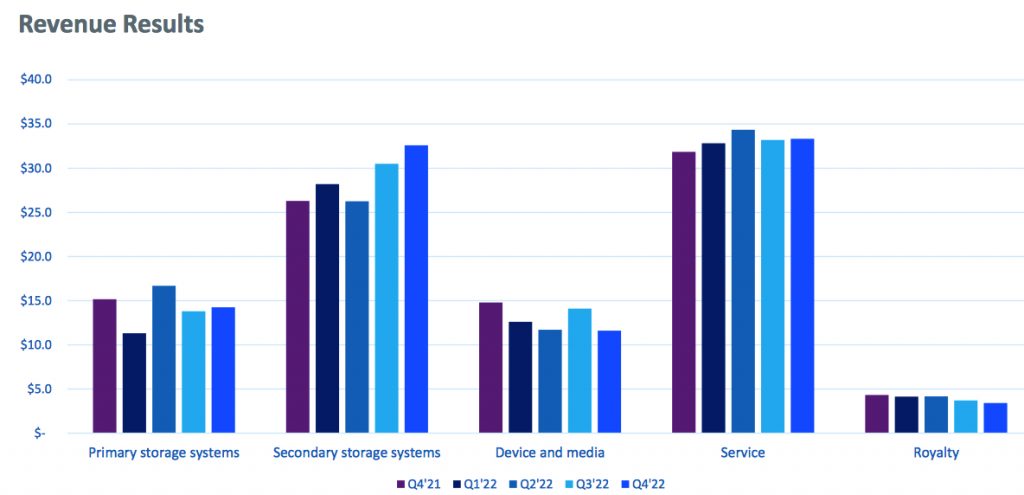
During 4FQ22, secondary storage revenues were up 6% Q/Q, primarily driven by ongoing strong demand from hyperscaler customers. Quantum continues to see improving supply of tape drives that has helped support the sequential revenue growth. Primary storage systems saw a modest rebound in the quarter and was up 3.4% Q/Q, primarily due to a continued gradual recovery in the M&E business, partially offset by continued weakness in U.S. federal business. Also in 4FQ22, the company continued to close multimillion dollar video surveillance deals that were not able to fulfill due to ongoing supply chain constraints. It expect this business to contribute more significant product revenue in FY23, though this business is expected to be lumpy and characterized by large deals with long sales cycles.
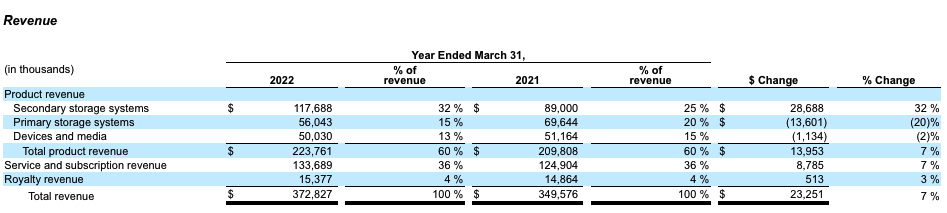
Product revenue
In FY22, it increased $14.0 million, or 7%, as compared to FY21. Secondary storage systems increased by 32%, driven by increased demand from large hyperscale customers, as well as continued strong demand globally for data protection and archive solutions. Primary storage systems decreased 20%, driven by large end-of-life purchases in the prior year. Devices and media decreased $1.1 million driven partially by decreased supply of LTO tape drives.
Service and subscription revenue
It increased Y/Y $8.8 million, or 7%, in FY22, due in part to acquisitions made during FY22. The increase also reflects a shift to subscription-based software licensing.
Royalty revenue
The company receives royalties from third parties that license its LTO media patents through its membership in the LTO consortium. Royalty revenue increased yearly $0.5 million, or 3%, in FY22, related to shifts in market unit volumes towards more recent technologies LTO-9 and LT-O8.
CEO Lerner commented: "Now I'd like to talk about our plans to increase earnings over the next 4 quarters. Through sales growth, operational expense reductions and price increases, combined with supply chain initiatives to drive margin expansion, our goal is to deliver substantial year-on-year improvements to adjusted EBITDA. While our sales are ramping, we are tightening operational expenses across the company. We are reducing discretionary spending, reducing our facilities footprint and expanding our global engineering presence as we continue to integrate recent acquisitions."
Revenue is expected to reach $94 million in 1FQ23, ±$3 million, or up between 2% and 9% Y/Y, and down 4% to up 2% Q/Q.
Fiscal year ended March 31
| (in $ million) | Revenue | Y/Y Growth | Net income (loss) |
| 1998 | 1,189.8 | NA |
170.8 |
| 1999 | 1,302.7 | 9% | (29.5) |
| 2000 | 1,418.9 | 9% | 40.8 |
| 2001 | 1,405.8 | -1% | 160.7 |
| 2002 | 1,087.8 | -23% | 42.5 |
| 2003 | 870.8 | -20% | (264.3) |
| 2004 | 808.3 | -7% | (62.0) |
| 2005 | 794.2 | -2% | (3.5) |
| 2006 | 834.3 | +5% | (41.5) |
| 2007 | 1,016.2 | +22% | (64.1) |
| 2008 | 975.7 | -4% | (60.2) |
| 2009 | 809.0 | -17% | (356.1) |
| 2010 | 681.4 | -16% | 16.6 |
| 2011 | 672.3 | -1% | 4.5 |
| 2012 | 652.4 | -3% | (8.8) |
| 2013 | 587.6 | -10% | (52.4) |
| 2014 | 553.2 | -6% | (21.5) |
| 2015* | 543.7 | -2% | 15.4 |
| 2016* | 479.8 | -12% | (75.6) |
| 2017* | 493.1 | 3% | (2.4) |
| 2018 |
437.7 |
-11% | (43.3) |
| 2019 |
402.7 |
-8% | (42.8) |
| 1FQ20 |
105.6 |
-2% | (3.8) |
| 2FQ20 |
105.8 |
18% | (2.3) |
| 3FQ20 |
103.3 | 1% | 4.7 |
|
4FQ20 |
88.2 |
-15% | (3.8) |
| 2020 |
402.9 |
0% | (5.2) |
| 1FQ21 |
73.3 |
-31% | (10.7) |
| 2FQ21 | 85.8 |
-19% | (4.6) |
| 3FQ21 |
98.0 |
5% | (2.7) |
| 4FQ21 |
92.4 | 5% | (17.5) |
| 2021 |
349.6 | -13% | (35.5) |
| 1FQ22 |
89.1 | 22% | (4.2) |
| 2FQ22 |
93.2 |
9% | (9.3) |
| 3FQ22 |
95.3 |
-3% | (2.7) |
| 4FQ22 |
95.2 | 3% | (7.8) |
| FY22 |
372.8 |
7% | (32.3) |
| 1FQ23 (estim.) |
94±3 |
2%-9% | NA |
* figures as restated


 Subscribe to our free daily newsletter


