


 Quantum: Fiscal 3Q22 Financial Results
Revenue up 2% Q/Q and down 3% Y/Y, net losses never stopping
This is a Press Release edited by StorageNewsletter.com on February 10, 2022 at 2:03 pm| (in $ million) | 3Q21 | 3Q22 | 9 mo. 21 | 9 mo. 22 |
| Revenue | 98.0 | 95.3 | 257.1 | 277.6 |
| Growth | -3% | 8% | ||
| Net income (loss) | (2.7) | (11.1) | (18.0) | (24.7) |
Quantum Corporation announced financial results for its fiscal third quarter ended December 31, 2021.
3FQ22 Financial Summary
- Revenue increased 2% sequentially to $95.3 million.
- Backlog reached a record $62 million, compared to $50.0 million in the prior quarter.
- Number of subscription customers grew 30% sequentially and more than 98% Y/Y.
Jamie Lerner, chairman and CEO, “Although the current supply constraints are limiting the magnitude of our near-term revenue growth, demand in the third quarter continued to remain near record levels, with bookings exceeding revenue for the fifth consecutive quarter. We also continued to make notable progress on our transformation with subscription revenue increasing greater than 190% and the number of subscription customers growing more than 98% Y/Y. Our integration of Pivot3 and EnCloudEn continues to see positive momentum with both product integration and cross-selling opportunities with other Quantum storage-based solutions driving expanding opportunities in the video surveillance market.
“Our business and customer order momentum remains at historically high levels, demonstrated by another quarter of record backlog. However, given the continued pressure on revenues due to supply chain constraints, combined with the increasing supply chain cost environment, we are immediately implementing a series of cost reduction measures, along with pricing increases, across our product categories. We continue to work closely with our suppliers to secure the inventory necessary in the coming quarters to meet the growing customer demand.”
3FQ22 vs. 2FQ22
Revenue for 3FQ22 was $95.3 million, representing an increase of 2.3% sequentially from $93.2 million last quarter. Gross profit in the third quarter of fiscal 2022 was $35.2 million, or 37% of revenue, compared to $38.4 million, or 41% of revenue, in the prior quarter.
Total operating expenses in 3FQ22 were $42.4 million, or 45% of revenue, compared to $39.3 million, or 42% of revenue, in the prior quarter. Selling, general and administrative expenses were $27.3 million in the quarter, compared to $26.9 million in 2FQ22. R&D expenses were $14.6 million in3FQ22, compared to $12.4 million last quarter.
GAAP net loss in 3FQ22 was $11.1 million, or ($0.19) per share, compared to a net loss of $9.3 million, or ($0.16) per share, in 2FQ22, which included a debt extinguishment charge of $15 million, partially offset by a gain of $10 million for the forgiveness on the PPP loan. Excluding stock compensation, restructuring charges and other non-recurring costs, non-GAAP adjusted loss in 3FQ22 was $4.6 million, or ($0.07) per diluted share, compared to adjusted net income of $0.1 million, or $0.00 per diluted share, last quarter.
Adjusted EBITDA in 3FQ22 was $0.8 million, compared to $5.3 million in the prior quarter.
Balance Sheet and Liquidity
- Cash and cash equivalents including restricted cash was $4.3 million as of December 31, 2021, compared to $23.2 million as of September 30, 2021.
- Outstanding debt as of December 31, 2021, was $101.7 million. This compares to $104.5 million of outstanding debt as of September 30, 2021.
- Total interest expense was $2.4 million, compared to $3.1 million for the three months ended September 30, 2021.
Outlook
Given the ongoing supply disruptions, and to a lesser extent historical seasonality, the company expects the following guidance range for 4FQ22:
- Revenues of $92 million, plus or min $5 million
- Non-GAAP adjusted net loss of ($4 million), plus or min$1 mi llion
- Non-GAAP adjusted net loss per share of ($0.07), plus or min$0.02
- Adjusted EBITDA of breakeven, plus or min $1 million
Comments
For the quarter, revenue was up 2% Q/Q and down 3% Y/Y at $95.3 million, and it was estimated last quarter at $104±5 million.
The company registered net losses during last 8 quarters.
3FQ22 revenue with backlog increases sequentially to $62 million, a quarterly record for the company, with strong demand offset by ongoing supply chain headwinds.
Recurring revenue transition continued to accelerate with 255 customers utilizing subscription solutions, up 30% Q/Q and 98% Y/Y.
GAAP and non-GAAP gross margin in 3FQ22 was 37%, down over 4% points from the prior quarter.
As a result of the strong customer demand, coupled with the supply chain constraints, the customer order backlog grew over $10 million during the quarter to $62 million from $50 million last quarter and $30 million as of June 30, 2021. Approximately $26 million of orders in the ending backlog could have been shipped to customers in 3FQ22, if the firm would have had the support from the supply chain. This $26 million in unfulfilled orders compares to just over $15 million in unfulfilled orders in the prior quarter.
With more products transitioning to a subscription contract, Y/Y subscription revenues increased 190%. 3FQ22 represents 5th sequential quarter of bookings exceeding revenue.
Just over $50 million of the ending backlog represented tape products for which the majority was for orders from hyperscale customers. Quantum anticipate that the supply chain constraints will remain challenging, eliminating the company's ability to ship against all customer demand and recognize a meaningful portion of the current backlog.
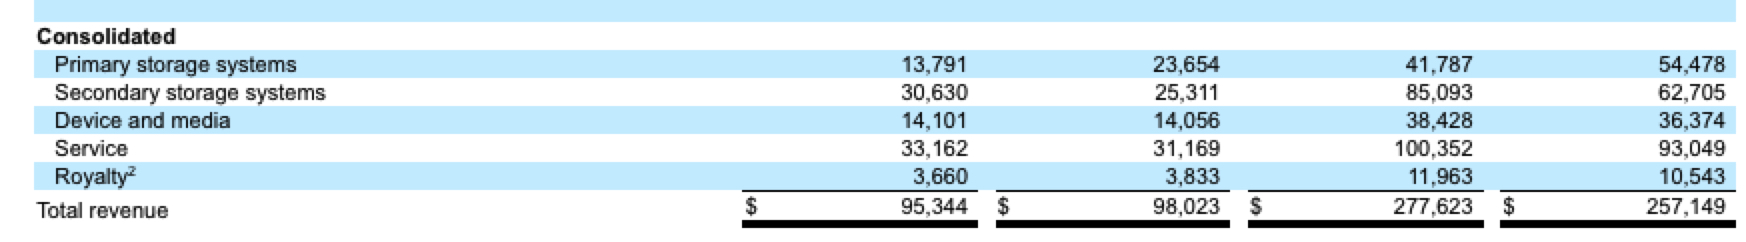
During 3FQ22, secondary storage revenues were up 17% Q/Q, primarily driven by the increase in hyperscaler revenues, as well as the improving supply of LTO-7 and LTO-8 drives that help support sequential revenue growth.
During the third quarter, LTO-9 tape drives started shipping, but overall supply of LTO-9 drive has been constrained due to initial manufacturing challenges. This was especially notable with one of firm's largest hyperscale customers who converted a large order for LTO-8 to LTO-9 drives during the quarter and increased their order by $10 million. Due to limited availability of LTO-9 drives, this switch impacted company's ability to fulfill the order and Quantum reported revenue as its prior guidance included shipments for LTO-8-based drives to this customer.
In addition to the headwinds, the company is facing in supply of tape drives, it's experiencing broad-based shortages of components for servers, network cards and circuit boards, consistent with what peers in the storage industry are citing.
Primary storage systems saw a sequential decline in revenue, down 17%, partially due to a delay in the recovery within federal vertical combined with deferring a portion of revenue as the company grows subscription business with revenues from StorNext.
Hyperscale business grew meaningfully both Q/Q and Y/Y despite the supply challenges and has become less lumpy over the last 4 quarters.
Media and entertainment vertical has begun to stabilize, while not above pre-Covid levels.
The increase in devices and media during 3FQ22, up 20% Q/Q, benefited from improved supply of certain tape drives following multiple quarters of headwinds.
Progress within StorNext, the first point product the firm transitioned to a subscription model has begun to take hold. Revenue for StorNext in 3FQ22 were flat Y/Y, but the prior year was primarily a product sale.
The increase in backlog has been over the last 5 quarters, while revenue has remained essentially flat. The disconnect between reported quarterly revenue and acceleration in levels of backlog is due to the unprecedented headwinds faced within supply chain.
Fiscal year ended March 31
| (in $ million) | Revenue | Y/Y Growth | Net income (loss) |
| 1998 | 1,189.8 | NA |
170.8 |
| 1999 | 1,302.7 | 9% | (29.5) |
| 2000 | 1,418.9 | 9% | 40.8 |
| 2001 | 1,405.8 | -1% | 160.7 |
| 2002 | 1,087.8 | -23% | 42.5 |
| 2003 | 870.8 | -20% | (264.3) |
| 2004 | 808.3 | -7% | (62.0) |
| 2005 | 794.2 | -2% | (3.5) |
| 2006 | 834.3 | +5% | (41.5) |
| 2007 | 1,016.2 | +22% | (64.1) |
| 2008 | 975.7 | -4% | (60.2) |
| 2009 | 809.0 | -17% | (356.1) |
| 2010 | 681.4 | -16% | 16.6 |
| 2011 | 672.3 | -1% | 4.5 |
| 2012 | 652.4 | -3% | (8.8) |
| 2013 | 587.6 | -10% | (52.4) |
| 2014 | 553.2 | -6% | (21.5) |
| 2015* | 543.7 | -2% | 15.4 |
| 2016* | 479.8 | -12% | (75.6) |
| 2017* | 493.1 | 3% | (2.4) |
| 2018 |
437.7 |
-11% | (43.3) |
| 2019 |
402.7 |
-8% | (42.8) |
| 1FQ20 |
105.6 |
-2% | (3.8) |
| 2FQ20 |
105.8 |
18% | (2.3) |
| 3FQ20 |
103.3 | 1% | 4.7 |
|
4FQ20 |
88.2 |
-15% | (3.8) |
| 2020 |
402.9 |
0% | (5.2) |
| 1FQ21 |
73.3 |
-31% | (10.7) |
| 2FQ21 | 85.8 |
-19% | (4.6) |
| 3FQ21 |
98.0 |
5% | (2.7) |
| 4FQ21 |
92.4 | 5% | (17.5) |
| 2021 |
349.6 | -13% | (35.5) |
| 1FQ22 |
89.1 | 22% | (4.2) |
| 2FQ22 |
93.2 |
9% | (9.3) |
| 3FQ22 |
95.3 |
-3% | (2.7) |
| 4FQ22 (estim.) |
92±5 | -2%/-9% | NA |
| FY22 (estim.) |
364.6-374.6 |
4%-7% | NA |
* figures as restated


 Subscribe to our free daily newsletter


