


 Quantum: Fiscal 1Q22 Financial Results
Sales up 22% Y/Y and down 4% Q/Q with net loss not stopping
This is a Press Release edited by StorageNewsletter.com on August 11, 2021 at 1:03 pm| (in $ million) | 1Q21 | 1Q22 | Growth |
| Revenue |
73.3 | 89.1 | 22% |
| Net income (loss) | (10.7) | (4.2) |
Quantum Corporation announced financial results for its fiscal first quarter ended June 30, 2021.
1FQ22 financial summary and recent highlights
- Revenue grew 22% Y/Y to $89.1 million
- GAAP net loss was $4.2 million, or ($0.07) per share; adjusted non-GAAP net income was $0.1 million, or $0.00 per diluted share
- Adjusted EBITDA increased $4.0 million Y/Y to $5.4 million
- Software and subscription customers grew more than 20% sequentially, while bookings were up 2x
- Refinanced outstanding term debt, saving $7 million in annualized interest expense
- Acquired the video surveillance portfolio and assets from Pivot3, adding over 500 customers
Jamie Lerner, chairman and CEO, commented: “Demand in the first fiscal quarter continued to be strong, with a significant sequential increase in customer orders. A large majority of these orders were from hyperscale customers for products that are most affected by the current supply constraints. This dynamic has caused our backlog to reach unprecedented levels. Historically, our backlog has been 5% or less of our reported quarterly revenue. As of 1FQ22, our backlog has grown to $30 million, compared to approximately $14 million in the previous quarter and $2 million in the year-ago period. While not all backlog represents potential revenue in the following quarter, it demonstrates how robust demand is across our business, while also providing us significantly higher levels of visibility.
“Although the industry supply constraints have created near-term revenue headwinds, we continue to make progress on our long-term business transformation. Following the quarter close, we announced the acquisition of Pivot3’s video surveillance portfolio and assets, which is key step towards establishing a strong share position in the video surveillance market with a leading portfolio of hardware and software solutions. This acquisition will add over 500 customers and is projected to be slightly accretive to EBITDA through the remainder of fiscal 2022. More recently, we successfully refinanced our remaining outstanding term debt, allowing for more favorable borrowing terms and reducing future cash interest expense to help drive improvements to our bottom line.”
He concluded: “I am very pleased with our team’s continued execution and the increasing demand we are seeing for our products and software solutions. We are building upon our market share leadership position in the hyperscale market. Overall, I’m confident we are taking the right steps to position the company for long-term sustainable growth and profitability. And with the recent refinance of debt now behind us, we have completed an important milestone in our financial and business transformation, providing greater operating flexibility on our path to becoming the leader in video and unstructured data storage solutions.”
1FQ22 vs. 4FQ21
- Revenue was $89.1 million representing a decrease of 4% sequentially from $92.4 million last quarter.
- Gross profit in the first quarter of fiscal 2022 was $37.3 million, or 42% of revenue, compared to $38.9 million, or 42% of revenue, in the prior quarter.
- Total operating expenses were $37.3 million, or 42% of revenue, compared to $36.6 million, or 40% of revenue, in the prior quarter. Selling, general and administrative expenses were $25.8 million in the quarter, compared to $24.1 million in the fourth fiscal quarter 2021. R&D expenses were $11.3 million compared to $11.7 million last quarter.
- GAAP net loss was $4.2 million, or ($0.07) per share, compared to a net loss of $17.5 million, or ($0.35) per share, in 4FQ21 which included a debt extinguishment charge of $14.8 million related to the early retirement of $92.3 million of a senior secured term loan. Excluding stock compensation, restructuring charges and other non-recurring costs, non-GAAP adjusted net income was $0.1 million, or $0.00 per basic and diluted share, compared to adjusted net income of $2.1 million, or $0.03 per diluted share, last quarter.
- Adjusted EBITDA was $5.4 million, compared to $8.3 million in the prior quarter.
Balance sheet and liquidity
- Cash and cash equivalents of $24.6 million as of June 30, 2021, compared to $33.1 million as of March 31, 2021. Both balances include $5.0 million in restricted cash required under the company’s Credit Agreements, and $0.5 million and $0.7 million of short-term restricted cash as of June 30, 2021, and March 31, 2021, respectively.
- Outstanding long-term debt as of June 30, 2021, was $81.3 million, net of $8.8 million in unamortized debt issuance costs and $11.9 million in current portion of long-term debt. This compares to $90.9 million of outstanding debt as of March 31, 2021, net of $9.7 million in unamortized debt issuance costs and $1.9 million in current portion of long-term debt.
- Total interest expense was $3.9 million, compared to $5.7 million for the three ended June 30, 2021, and March 31, 2021, respectively.
Outlook
Given the continued uncertainties in the supply chain for 2FQ22, the company expects the following guidance range:
- Revenues of $88 million +/- $4 million (includes $2 million forecasted contribution from Pivot3 acquisition)
- Non-GAAP adjusted net loss of $2 million, plus or minus $1 million
- Non-GAAP adjusted net loss per share of $0.04, plus or minus $0.02
- Adjusted EBITDA of $2 million, plus or minus $1 million
For FY22, the company expects the following revenue guidance range:
- Revenues of $380 to $420 million, determined by the timing of supply chain improvements
- Guidance excludes Pivot3 revenue for fiscal year 2022
Comments
After a bad FY21 with sales down 13% at $349.6 million and net loss of $35.5 million - far for revenue record of $1,419 million or 4x more in FY20 -, this time the figures are $89.1 million for revenue in the quarter at the bottom of what was expected 3 months ago ($92 million, plus or minus $3 million), up 22% Y/Y and down 4% Q/Q, with net loss not never stopping during the last 7 fiscal quarters.
Cash and cash equivalents were $24.6 million as of June 30, 2021, compared to $33.1 million on March 31, 2021.
Revenue growth by category
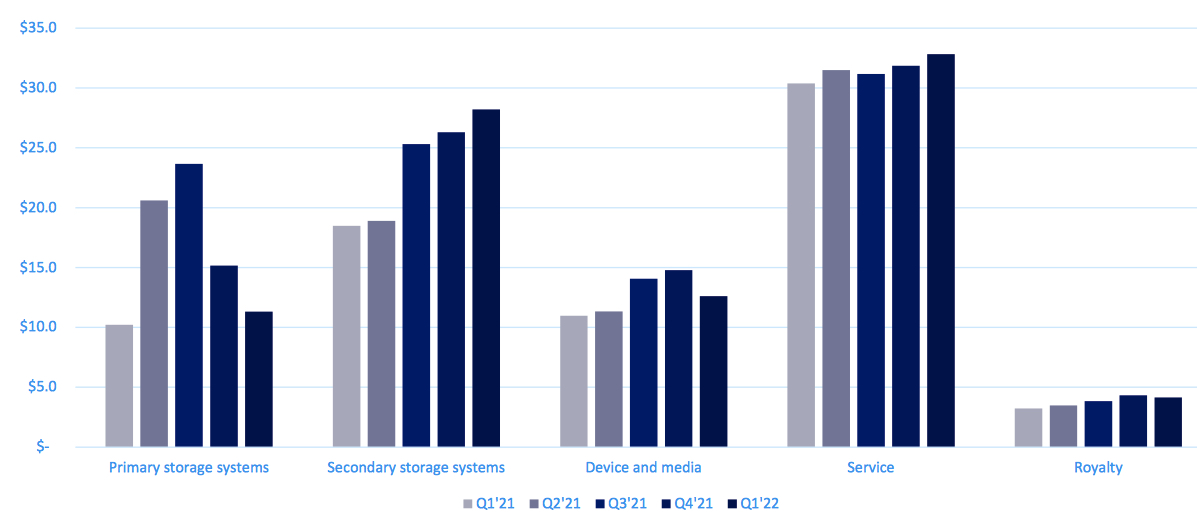
Primary storage systems declined sequentially, primarily as a result of the lumpiness of the M&E business during the Covid recovery period and, to a lesser extent, the impact of deferring software revenue sold separately on a subscription basis.
Near-term supply shortages continue to present headwinds for firm's secondary storage systems business during the most recent quarter. Revenues from secondary storage were up 7% sequentially but remained restricted by company's ability to obtain key components.
The sequential decrease in devices and media were impacted by supply constraints related to certain products.
Historically, backlog has been 5% or less of reported quarterly revenue for the company. As of 1FQ22, it has grown to $30 million, compared to $14 million in the previous quarter and $2 million in the year-ago period.
Next quarter is supposed to be flat Q/Q at $88 million ±$4 million in revenue but up 15% to 26% Y/Y.
For FY22, expected sales are $380 million to $420 million, an increase by 9% to 20% from FY21.
Fiscal year ended March 31
| (in $ million) | Revenue | Y/Y Growth | Net income (loss) |
| 1998 | 1,189.8 | NA |
170.8 |
| 1999 | 1,302.7 | 9% | (29.5) |
| 2000 | 1,418.9 | 9% | 40.8 |
| 2001 | 1,405.8 | -1% | 160.7 |
| 2002 | 1,087.8 | -23% | 42.5 |
| 2003 | 870.8 | -20% | (264.3) |
| 2004 | 808.3 | -7% | (62.0) |
| 2005 | 794.2 | -2% | (3.5) |
| 2006 | 834.3 | +5% | (41.5) |
| 2007 | 1,016.2 | +22% | (64.1) |
| 2008 | 975.7 | -4% | (60.2) |
| 2009 | 809.0 | -17% | (356.1) |
| 2010 | 681.4 | -16% | 16.6 |
| 2011 | 672.3 | -1% | 4.5 |
| 2012 | 652.4 | -3% | (8.8) |
| 2013 | 587.6 | -10% | (52.4) |
| 2014 | 553.2 | -6% | (21.5) |
| 2015* | 543.7 | -2% | 15.4 |
| 2016* | 479.8 | -12% | (75.6) |
| 2017* | 493.1 | 3% | (2.4) |
| 2018 |
437.7 |
-11% | (43.3) |
| 2019 |
402.7 |
-8% | (42.8) |
| 1FQ20 |
105.6 |
-2% | (3.8) |
| 2FQ20 |
105.8 |
18% | (2.3) |
| 3FQ20 |
103.3 | 1% | 4.7 |
|
4FQ20 |
88.2 |
-15% | (3.8) |
| 2020 |
402.9 |
0% | (5.2) |
| 1FQ21 |
73.3 |
-31% | (10.7) |
| 2FQ21 | 85.8 |
-19% | (4.6) |
| 3FQ21 |
98.0 |
5% | (2.7) |
| 4FQ21 |
92.4 | 5% | (17.5) |
| 2021 |
349.6 | -13% | (35.5) |
| 1FQ22 |
89.1 | 22% | (4.2) |
| 2FQ22 (estim.) |
88±4 |
15%-26% | NA |
| 2022 (estim.) |
380-420 | 9%-20% | NA |
* figures as restated


 Subscribe to our free daily newsletter


