 Pure Storage: Fiscal 1Q23 Financial Results
When company will finally be profitable after 9 years of losses?
This is a Press Release edited by StorageNewsletter.com on June 6, 2022 at 2:02 pm| (in $ million) | 1Q22 | 1Q23 | Growth |
| Revenue |
412.7 | 620.4 | 50% |
| Net income (loss) | (84.2) | (11.5) |
Pure Storage, Inc. announced financial results for its fiscal first quarter ended May 8, 2022.
“Pure’s continuing success is the direct result of our consistent focus on innovation and operational excellence,” said Charles Giancarlo, chairman and CEO. “We are delivering industry leading products, building a storage and management platform that is both powerful and easy to use, and providing exceptional customer experiences.”
1FQ23 Financial Highlights
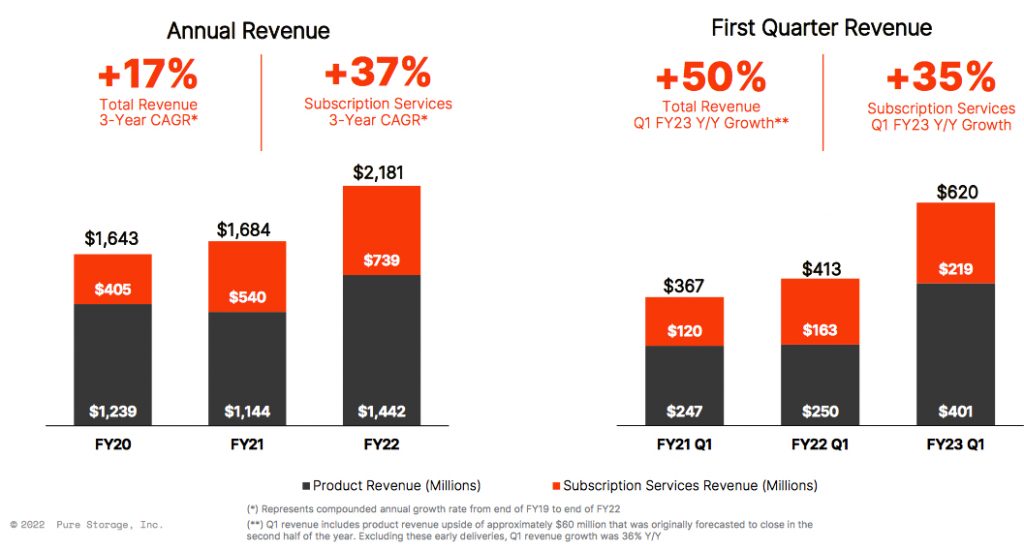
• Revenue $620.4 million, up 50% Y/Y
• Subscription services revenue $219.2 million, up 35% Y/Y
• Subscription Annual Recurring Revenue (ARR) $899.8 million, up 29% Y/Y
• Remaining Performance Obligations (RPO) $1.4 billion, up 26% Y/Y
• GAAP gross margin 68.7%; non-GAAP gross margin 70.6%
• GAAP operating loss $(4.6) million; non-GAAP operating income $85.4 million
• GAAP operating margin (0.7)%; non-GAAP operating margin 13.8%
• Operating cash flow $220.1 million; free cash flow $187.3 million
• Total cash, cash equivalents, and investments $1.3 billion
• Returned approximately $66 million to stockholders through share repurchases
“We are very pleased with our exceptional performance this quarter, marking a strong start to the fiscal year,” said Kevan Krysler, CFO. “Pure’s flash leadership makes us the best choice for customers who prioritize performance, reliability, and reducing their energy consumption. Our solutions make a significant and immediate impact in reducing data center carbon emissions, delivering longer service lifetimes, and reducing e-waste.”
1FQ23 Company Highlights
• Commitment to Sustainability: Released its inaugural Environmental, Social, Governance (ESG) report, providing visibility into the company’s current metrics and setting commitments for making meaningful progress toward a better future for the global community. Key report highlights:
-
- Pure enables businesses and organizations to drive out direct energy usage in their storage systems by up to 80% compared to competitive all-flash products and even more compared to disk-based systems.
- More than 97% of Pure arrays purchased 6 years ago are still in service, and benefiting from continual modernization through Evergreen program.
- As part of the company’s goal to reduce Scope 3 emissions, is committing to further reducing product emissions by 66% per petabyte by 2030.
- Market-Leading Portfolio Innovation: Pure Fusion and Portworx Data Services are now available, enabling customers to bring infrastructure and applications closer together with cloud-like automation and storage delivery for traditional and cloud-native applications. Additionally, FlashBlade was recognized as a leader in the 2022 IDC MarketScape for Distributed Scale Out File Storage due to its ease of use, consistent performance at scale, metadata architecture, and customer experience.
- Momentum Across Technology Partnerships: Announced new partnerships with Snowflake and Kyndryl, and an expanded partnership with Amazon Web Services (AWS) in 1FQ23 to deliver expertise, mission-critical capabilities, and enablement programs to global enterprises.
- Pure//Accelerate techfest22 will take place in-person in Los Angeles, CA, and virtually on June 8.
Comments
Revenue for 1FQ23 at $620.4 million is largely above expectation that was $520 million.
Per comparison, NetApp records $3.2 billion annual net revenue run rate in AFAs for its most recent financial quarter. Other competitors Dell and HPE didn't reveal AFA sales.
Total revenue

The strength of subscription business continues as annual recurring revenue grew 29% to $900 million, remaining performance obligations, or RPO grew to $1.43 billion. Subscription services revenue was up approximately 35% Y/Y and represented around 35% of total revenue.
Revenue in USA grew 57% and international revenue 33% Y/Y.
Total and new customers

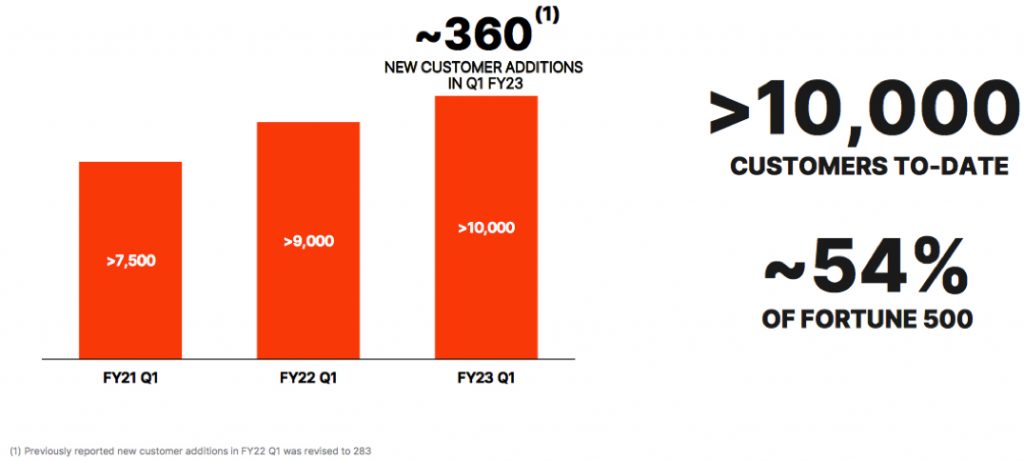
Total customer count reflects the acquisition of approximately 360 new customers this quarter and includes 54% of the US Fortune 500 customers.
Next quarter, sales are expected to reach $635 million growing around 28% Y/Y or a mere 2% Q/Q.
FY revenue guidance has been increased from $2.6 to $2.66 billion, or up around 22% Y/Y.
Well, Pure is growing at a high rate since many years but without any profitable fiscal year since 2013!
According to Yahoo!finance, "Consensus from 18 of the American Tech analysts is that Pure is on the verge of breakeven. They expect the company to post a final loss in 2024, before turning a profit of $111 million in 2025. The company is therefore projected to breakeven around 3 years from today. In order to meet this breakeven date, we calculated the rate at which the company must grow year-on-year. It turns out an average annual growth rate of 112% is expected, which signals high confidence from analysts. If this rate turns out to be too aggressive, the company may become profitable much later than analysts predict."
Our opinion is that Pure could come back to profit before that and maybe this current fiscal year. Net loss is down for 1FQ23 at only $11.5 million, the lowest figure never seen, and generally decreasing the following quarters.
Revenue in $ million
(FY ended in January)
| Period | Revenue | Y/Y growth | Loss |
| FY13 | 6.1 | NA | (23.4) |
| FY14 | 42.7 | 603% | (78.6) |
| FY15 | 174.5 | 308% | (183.2) |
| FY16 | 440.3 | 152% | (213.8) |
| FY17 | 728.0 | 65% | (245.1) |
| FY18 |
1,023 | 41% |
(159.9) |
| FY19 |
1,360 | 33% |
(178.4) |
| 1Q20 |
326.7 | 28% |
(100.3) |
| 2Q20 |
396.3 | 28% |
(66.2) |
| 3Q20 |
428.4 | 15% | (28.2) |
| 4Q20 |
492.0 | 17% |
(4.7) |
| FY20 |
1,643 | 21% | (201.0) |
| 1F21 |
367.1 | 12% |
(90.6) |
| 2F21 |
403.7 | 2% |
(65.0) |
| 3F21 |
410,.6 | -4% |
(74.2) |
| 4F21 |
502.7 | 2% |
(52.2) |
| FY21 |
1,684 | 2% |
(282.1) |
| 1F22 |
412.7 | 12% |
(84.2) |
| 2F22 |
496.8 | 23% |
(45.3) |
| 3F22 |
562.7 | 29% |
(28.7) |
| 4F22 |
708.6 | 41% |
14.9 |
| FY22 |
2,181 |
30% |
(143.3) |
| 1F23 | 620.4 | 50% |
(11.5) |
| 2F23* |
∼635 | 28% |
NA |
| FY23* |
2,660 |
22% |
NA |
* Estimations


 Subscribe to our free daily newsletter
