


 Box: Fiscal 3Q22 Financial Results
Sales and losses increasing, 14% and 162%, respectively
This is a Press Release edited by StorageNewsletter.com on December 6, 2021 at 2:02 pm| (in $ million) | 3Q21 | 3Q22 | 9 mo. 21 | 9 mo. 22 |
| Revenue | 196.0 | 224.0 | 571.9 | 641.0 |
| Growth | 14% | 12% | ||
| Net income (loss) | (5.3) | (13.9) | (38.5) | (37.1) |
Box, Inc. announced preliminary financial results for the third quarter of fiscal year 2022, which ended October 31, 2021.
“Our strong third quarter results show the continued momentum of our long-term growth strategy, as more customers are turning to the Box Content Cloud to deliver secure content management and collaboration built for the new way of working,” said Aaron Levie, co-founder and CEO. “In addition to our solid financial and customer metrics, we made meaningful product announcements in the third quarter, including the rollout of Box Sign globally, new malware deep scan capability in Box Shield to combat ransomware, and deeper integrations with Microsoft Office and Teams, Salesforce, Slack and Zoom. The confluence of remote work, digital transformation and cybersecurity challenges is causing enterprises to rethink how they work with their content. We believe Box’s leadership in the Content Cloud market is driving the acceleration of our growth and the expansion of our customer footprint.”
“We achieved strong third quarter results, marking our third consecutive quarter of accelerating revenue growth,” said Dylan Smith, co-founder and CFO. “Strong Suites momentum is accelerating customer traction and adoption, driving a third quarter net retention rate of 109%, up 600 basis points from 103% in the year ago period and up 300 basis points sequentially. Today we raised our outlook for FY22 revenue, non-GAAP operating margin, and non-GAAP EPS and our ongoing momentum provides us further confidence we will achieve our FY24 financial targets.”
3FQ22 Highlights
• Revenue was $224.0 million, an increase of 14% from 3FQ21. For the third consecutive quarter, revenue growth accelerated on a yearly basis.
• Remaining performance obligations were $948.1 million, a 25% increase from 3FQ21, and 1,100 bps higher than revenue growth for the same period
• Deferred revenue was $429.7 million, a 21% increase from 3FQ21.
• Billings were $231.5 million, a 25% increase from 3FQ21.
• GAAP gross profit was $161.0 million, or 72% of revenue. This compares to a GAAP gross profit of $139.2 million, or 71% of revenue, in 3FQ21.
• Non-GAAP gross profit was $167.3 million, or 75% of revenue. This compares to a non-GAAP gross profit of $143.9 million, or 73% of revenue, in 3FQ21.
• GAAP operating loss was $11.1 million, or 5% of revenue. This compares to a GAAP operating loss of $2.6 million, or 1% of revenue, in 3FQ21.
• Non-GAAP operating income was $46.4 million, or 21% of revenue. This compares to a non-GAAP operating income of $35.2 million, or 18% of revenue, in 3FQ21.
• GAAP net loss per share attributable to common stockholders, basic and diluted, was $0.12 on 151.4 million weighted-average shares outstanding. This compares to a GAAP net loss per share attributable to common stockholders of $0.03 in 3FQ21 on 157.5 million weighted-average shares outstanding.
• Non-GAAP net income per share attributable to common stockholders, diluted, was $0.22. This compares to a non-GAAP net income per share attributable to common stockholders, diluted, of $0.20 in 3FQ21.
• Net cash provided by operating activities was $46.1 million, an increase of 2% from net cash provided by operating activities of $45.1 million in 3FQ21.
• Free cash flow was positive $31.2 million. This compares to free cash flow of positive $26.2 million in 3FQ21.
Share Repurchase Program
On November 27, 2021, the board of directors authorized an expansion of its stock repurchase program by $200 million of Class A common stock, increasing the aggregate amount of its approved share buyback programs to $700 million, including the Dutch Tender Offer from earlier this year. With this expanded authorization, and excluding funds previously used to repurchase shares to date, as of November 29, 2021, the company had approximately $260 million of remaining buyback capacity.
4FQ22 guidance:
Revenue is expected to be in the range of $227 million to $229 million, up 15% Y/Y at the high-end of the range. GAAP operating margin is expected to be approximately 1%, and non-GAAP operating margin is expected to be approximately 21%. GAAP basic and diluted net loss per share attributable to common stockholders are expected to be in the range of $0.06 to $0.05. Non-GAAP diluted net income per share attributable to common stockholders is expected to be in the range of $0.22 to $0.23. Weighted-average basic and diluted shares outstanding are expected to be approximately 150 million and 158 million, respectively.
FY22 guidance:
Revenue is expected to be in the range of $868 million to $870 million, up 13% Y/Y at the high-end of the range and represents an acceleration from last year’s growth rate of 11%. GAAP operating margin is expected to be approximately negative 3%, and non-GAAP operating margin is expected to be approximately 20%. GAAP basic and diluted net loss per share attributable to common stockholders are expected to be in the range of $0.35 to $0.34. Non-GAAP diluted net income per share attributable to common stockholders is expected to be in the range of $0.83 to $0.84. Weighted-average basic and diluted shares outstanding are expected to be approximately 156 million and 164 million, respectively.
Comments
Revenue of $224 million is up 14% Y/Y and 4% Q/Q, a third consecutive quarter of accelerating growth and above the high end of guidance ($218-$219 million). Non-GAAP EPS was also above guidance.
Shares were up 11.8% after these results were revealed.
Sales were always growing historically but with net loss never ending (but in 1FQ21). (see table below)
The company derives its revenue primarily from 3 sources:
- subscription
- customers purchasing premier services package; and
- professional services such as implementing best practice use cases, project management and implementation consulting services.
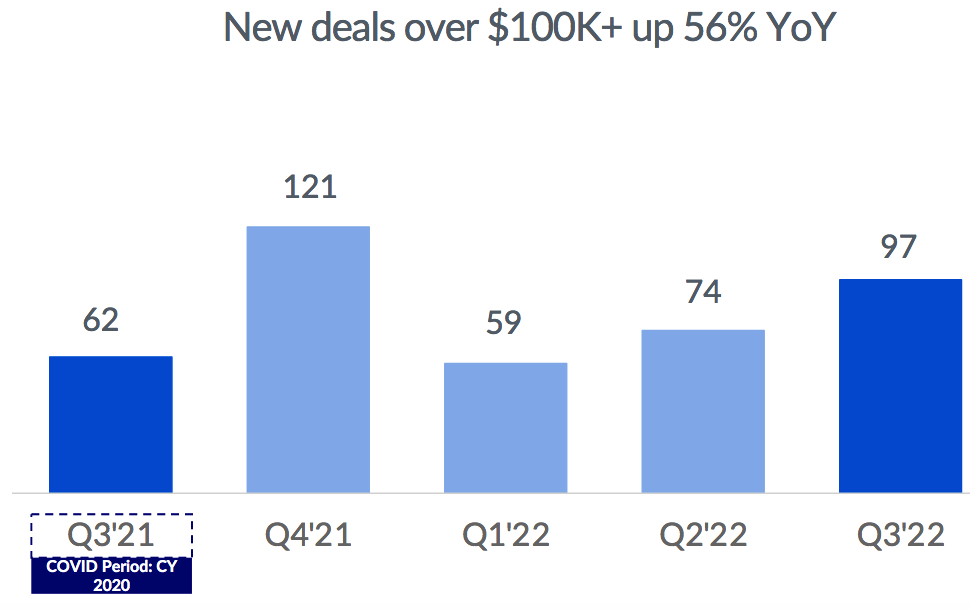
In 3FQ22, net retention rate was 109%, up from 103% in 3FQ21 and from 106% in 2FQ22. Box had 97 deals over $100,000, up 56% Y/Y, including a record number of multi-product suite sales, which now includes Enterprise Plus plan with 61 Suite deals in 3FQ22 deals over $100,000, up 177% Y/Y. It had a 63% attach rate of Suites over $100,000 in the quarter, up from 35% in 3FQ21.
In North America and EMEA, Suites attach rates were in the mid-70s in 3FQ22 but declined sequentially in Japan.
3Q22 billings of $231 million grew yearly 25% and ahead of expectations to deliver a 3FQ22 billings growth rate in line with revenue growth. This outcome reflects the continued strong sales execution the company saw in its enterprise and SMB markets.
Next quarter, Box expects sales in the range of $227-$229 million or up 14% to 15% Q/Q.
FY22 revenue guidance was raised from $845-$853 million to $868-$870 million, increasing approximately 13% Y/Y.
Revenue and net income (loss) in $ million
| Period | Revenue | Y/Y growth | Net income (loss) |
| FY11 | 21.1 | NA | (53.3) |
| FY12 | NA | NA | NA |
| FY13 | 58.8 | NA | (112.6) |
| FY14 | 124.2 | 112% | (168.6) |
| FY15 | 216.4 | 74% | (168.2) |
| FY16 | 302.7 | 40% | (202.9) |
| FY17 | 398.6 | 32% | (150.8) |
| FY18 | 506.1 | 27% | (155.0) |
| FY19 | 608.4 | 20% | (134.6) |
| FY20 | 696.2 | 14% | (144.3) |
| 1FQ21 | 183.6 | 13% | 2.6 |
| 2FQ21 | 192.3 | 11% | (7.7) |
| 3FQ21 | 196.0 | 11% | (5.3) |
| 4FQ21 | 198.9 | 8% | (4.9) |
| FY21 | 770.8 | 11% | (43.4) |
| 1FQ22 | 202.4 | 2% | (14.6) |
| 2FQ22 | 214.5 | 11% | (8.7) |
| 3FQ22 | 224.0 | 14% | (13.9) |
| 4FQ22* | 227-229 | 14%-15% | NA |
| FY22* | 868-870 | 13% | NA |
* Estimations
Note: IPO in 2015 raising $175 million
Earnings call transcript


 Subscribe to our free daily newsletter


