


 Box: Fiscal 4Q22 Financial Results
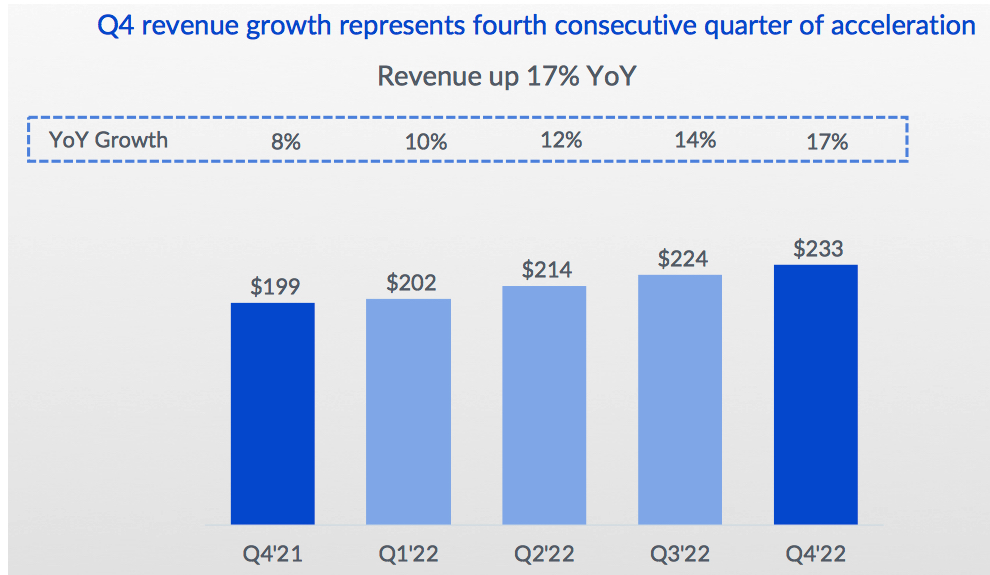
Y/Y revenue growth of 17% at $233 million, about never profitable and Y/Y net loss even increasing
This is a Press Release edited by StorageNewsletter.com on March 8, 2022 at 2:02 pm| (in $ million) | 4Q20 | 4Q22 | FY21 | FY22 |
| Revenue | 198.9 | 233.4 | 770.8 | 874.3 |
| Growth | 17% | 13% | ||
| Net income (loss) | (4.9) | (8.7) | (43.4) | (41.5) |
Box, Inc. announced preliminary financial results for the fourth quarter and fiscal year 2022, which ended January 31, 2022.
“In FY22, we achieved strong results across all of our financial metrics, executing on our vision for the Box Content Cloud while exceeding our guidance for growth and profitability,” said Aaron Levie, co-founder and CEO. “Businesses today are adopting a digital-first, cloud-delivered focus, reimagining how they work in a world of distributed and hybrid teams. Content is at the center of this shift, and Box is uniquely positioned to capitalize on this opportunity. Our strong execution in FY22 and continued business momentum give us confidence in our ability to drive continued growth while delivering the content cloud platform to our customers.”
“We are proud to have delivered a combined revenue growth plus free cash flow margin outcome of 33% in FY22, ahead of our target and up from 26% a year ago,” said Dylan Smith, co-founder and CFO. “With a sharp focus on delivering profitable growth as we capitalize on our expanded market opportunity, we expect to deliver another year of accelerating revenue growth and expanding operating margins for the full year of FY23.”
4FQ22 Financial Highlights
• Revenue was $233.4 million, a 17% increase from revenue for 4FQ21 of $198.9 million.
• Remaining performance obligations as of January 31, 2022, were $1.1 billion, a 19% increase from remaining performance obligations as of January 31, 2021 of $896.9 million.
• Deferred revenue as of January 31, 2022, was $534.2 million, a 15% increase from deferred revenue as of January 31, 2021 of $465.6 million.
• Billings were $337.9 million, a 9% increase from billings for 4FQ21 of $310.1 million.
• GAAP gross profit was $168.7 million, or 72% of revenue. This compares to a GAAP gross profit of $140.3 million, or 71% of revenue, in 4FQ21.
• Non-GAAP gross profitwas $175.2 million, or 75% of revenue. This compares to a non-GAAP gross profit of $145.6 million, or 73% of revenue, in 4FQ21.
• GAAP operating loss was $0.2 million, or 0% of revenue. This compares to a GAAP operating loss of $3.3 million, or 2% of revenue, in 4FQ21.
• Non-GAAP operating income was $48.5 million, or 21% of revenue. This compares to a non-GAAP operating income of $36.4 million, or 18% of revenue, in 4FQ21.
• GAAP net loss per share attributable to common stockholders, basic and diluted was $0.06 on 148.3 million weighted-average shares outstanding. This compares to a GAAP net loss per share attributable to common stockholders of $0.03 in 4FQ21 on 159.2 million weighted-average shares outstanding.
• Non-GAAP net income per share attributable to common stockholders, diluted was $0.24. This compares to a non-GAAP net income per share attributable to common stockholders, diluted, of $0.22 in 4FQ21.
• Net cash provided by operating activities was $49.2 million. This compares to net cash provided by operating activities of $57.5 million in 4FQ21.
• Free cash flow was $33.3 million. This compares to free cash flow of $41.0 million in 4FQ21.
FY22 Financial Highlights
• Revenue was $874.3 million, a 13% increase from revenue for fiscal year 2021 of $770.8 million and an improvement from FY21’s growth of 11%.
• Billings were $941.9 million, a 16% increase from billings for FY21 of $812.5 million.
• GAAP gross profit was $624.8 million, or 71% of revenue. This compares to a GAAP gross profit of $546.0 million, or 71% of revenue, in FY21.
• Non-GAAP gross profit was $650.1 million, or 74% of revenue. This compares to a non-GAAP gross profit of $565.0 million, or 73% of revenue, in FY21.
• GAAP operating loss was $27.6 million, or 3% of revenue. This compares to a GAAP operating loss of $37.6 million, or 5% of revenue, in FY21.
• Non-GAAP operating income was $173.4 million, or 20% of revenue. This compares to a non-GAAP operating income of $118.8 million, or 15% of revenue, in FY21.
• GAAP net loss per share attributable to common stockholders, basic and diluted, was $0.35 on 155.6 million weighted-average shares outstanding. This compares to a GAAP net loss per share attributable to common stockholders of $0.28 in FY21 on 155.8 million weighted-average shares outstanding.
• Non-GAAP net income per share attributable to common stockholders, diluted, was $0.85. This compares to a non-GAAP net income per share attributable to common stockholders, diluted, of $0.70 in FY21.
• Net cash provided by operating activities was $234.8 million. This compares to net cash provided by operating activities of $196.8 million in FY21.
• Free cash flow was $170.2 million, an increase of 41% from free cash flow of $120.3 million in FY21.
1FQ23 Guidance
Revenue is expected to be in the range of $233 million to $235 million, up 16% Y/Y at the high-end of the range. GAAP operating margin is expected to be approximately 1%, and non-GAAP operating margin is expected to be approximately 21%. GAAP basic and diluted net loss per share attributable to common stockholders are expected to be in the range of $0.05 to $0.04. Non-GAAP diluted net income per share attributable to common stockholders is expected to be in the range of $0.24 to $0.25. Weighted-average basic and diluted shares outstanding are expected to be approximately 146 million and 152 million, respectively.
FY23 Guidance
Revenue is expected to be in the range of $990 million to $996 million, up 14% Y/Y at the high-end of the range, and represents an acceleration from last year’s growth rate of 13%. GAAP operating margin is expected to be approximately 2%, and non-GAAP operating margin is expected to be approximately 22%. GAAP basic and diluted net loss per share attributable to common stockholders are expected to be in the range of $0.07 to $0.03. Non-GAAP diluted net income per share attributable to common stockholders is expected to be in the range of $1.10 to $1.14. Weighted-average basic and diluted shares outstanding are expected to be approximately 148 million and 154 million, respectively.
Comments
Box was expected last quarter revenue in the range of $227-$229 million or up 14% to 15%. Finally it's more than that, $233.4 million, up 17% Y/Y.
Net retention rate was 111%, up from 102% and up from 109% in 3FQ22, driven by the continued stickiness of platform and customer expansion rates.
Box had 128 deals over $100,000 and 9 deals over $1 million during the quarter, up from 121 and 4 respectively. And for FY22, $100,000-plus deals grew 25% Y/Y.
It now has 1,420 customers paying more than $100,000 annually, up 17% Y/Y and 119 customers paying more than $1 million annually, up 20% Y/Y.
It had a record number of our multiproduct suite sales, which now includes firm's Enterprise Plus plan, with 83 suite deals in 4FQ22 over $100,000, up 51% Y/Y. And for FY22, Suite deals over $100,000 were up 110% Y/Y.
4FQ22 billings of $338 million represented 9% yearly growth and was at the high end of company's 4FQ22 expectations of high single-digit growth. For FY22, the vendor delivered billings growth of 16%, above revenue growth rate and the full 7% point improvement from the prior year.
In 1FQ23, sales of $233-$35 milion are expected, up 15% to 16% Y/Y.
FY22 revenue guidance has been raised, from $868-$870 million announced last quarter, to $990-$996 million, up 13% to 14% Y/Y.
Revenue and net income (loss) in $ million
| Period | Revenue | Y/Y growth | Net income (loss) |
| FY11 | 21.1 | NA | (53.3) |
| FY12 | NA | NA | NA |
| FY13 | 58.8 | NA | (112.6) |
| FY14 | 124.2 | 112% | (168.6) |
| FY15 | 216.4 | 74% | (168.2) |
| FY16 | 302.7 | 40% | (202.9) |
| FY17 | 398.6 | 32% | (150.8) |
| FY18 | 506.1 | 27% | (155.0) |
| FY19 | 608.4 | 20% | (134.6) |
| FY20 | 696.2 | 14% | (144.3) |
| 1FQ21 | 183.6 | 13% | 2.6 |
| 2FQ21 | 192.3 | 11% | (7.7) |
| 3FQ21 | 196.0 | 11% | (5.3) |
| 4FQ21 | 198.9 | 8% | (4.9) |
| FY21 | 770.8 | 11% | (43.4) |
| 1FQ22 | 202.4 | 2% | (14.6) |
| 2FQ22 | 214.5 | 11% | (8.7) |
| 3FQ22 | 224.0 | 14% | (13.9) |
| 4FQ22 | 233.4 | 17% | (8.7) |
| FY22 | 874.3 | 13% | (41.5) |
| 1FQ23* | 233-235 | 15%-16% | NA |
| FY23* | 990-996 | 13%-14% | NA |
* Estimations
Note: IPO in 2015 raising $175 million
Earnings call transcript


 Subscribe to our free daily newsletter


