


 Dropbox: Fiscal 2Q21 Financial Results
Revenue up 13.5% Y/Y at $530.6 million, 5x more profit
This is a Press Release edited by StorageNewsletter.com on August 9, 2021 at 1:32 pm| (in $ million) | 2Q20 | 2Q21 | 6 mo. 20 | 6 mo. 21 |
| Revenue | 467.4 | 530.6 | 922.4 | 1,042.2 |
| Growth | 14% | 13% | ||
| Net income (loss) | 17.5 | 88.0 | 56.8 | 135.6 |
Dropbox, Inc. announced financial results for its second quarter ended June 30, 2021.
“2Q was a standout quarter, driven by strong revenue growth, record free cash flow, and margin expansion,” said co-founder and CEO Drew Houston. “Our results reflect the strength of our business model and our ability to make significant progress on our strategic objectives. We’re proud of our execution this quarter as we delivered even more value to our customers and shareholders and are excited about the opportunity ahead to build next-gen tools to support the new world of distributed work.”
2FQ21 Results
• Total revenue was $530.6 million, an increase of 13.5% from 2FQ20. On a constant currency basis, Y/Y growth would have been 11.4%.(1)
• Total ARR ended at $2.166 billion, an increase of $53.8 million Q/Q and an increase of 12.2% Y/Y. On a constant currency basis, Y/Y growth would have been 10.6%.(2)
• Paying users ended at 16.14 million, as compared to 14.96 million for 2FQ20. Average revenue per paying user was $133.15, as compared to $126.88 for 2FQ20.
• GAAP gross margin was 79.8%, as compared to 78.1% in 2FQ20. Non-GAAP gross margin was 81.2%, as compared to 79.2% in 2FQ20.
• GAAP operating margin was 15.9%, as compared to 2.7% in 2FQ20. Non-GAAP operating margin was 31.9%, as compared to 20.6% in 2FQ20.
• GAAP net income was $88.0 million, as compared to $17.5 million in 2FQ20. Non-GAAP net income was $160.5 million, as compared to $93.2 million in 2FQ20.
• Net cash provided by operating activities was $219.9 million, as compared to $145.9 million in 2FQ20. Free cash flow was $216.0 million, as compared to $119.8 million in 2FQ20.
• GAAP diluted net income per share attributable to common stockholders was $0.22, as compared to $0.04 in 2FQ20. Non-GAAP diluted net income per share attributable to common stockholders was $0.40, as compared to $0.22 in 2FQ20.(3)
• Cash, cash equivalents and short-term investments ended at $1.944 billion.
(1) The company calculates constant currency revenue growth rates by applying the prior period weighted average exchange rates to current period results.
(2) It calculates total annual recurring revenue (total ARR) as the number of users who have active paid licenses for access to our platform as of the end of the period, multiplied by their annualized subscription price to our platform. It adjusts its exchange rates used to calculate total ARR on an annual basis, at the beginning of each fiscal year. It calculates constant currency Total ARR growth rates by applying the current period rate to prior period results.
(3) Non-GAAP diluted net income per share attributable to common stockholders is calculated based upon 397.0 million and 420.5 million diluted weighted-average shares of common stock for the three months ended June 30, 2021 and 2020, respectively.
Comments
Total revenue for this second quarter increased 14% Y/Y to $531 million, beating guidance range of $522 million to $525 million, driven by strength in professional SKU and improvements in retention, particularly on mobile platform.
Dreopbox exited the quarter with 16.14 million paying users and added 310,000 net new paying users 2FQ21, driven in part by the continued adoption of firm's Family plan. Average revenue per paying user was $133.15 in the more recent quarter.
The company noted that its team has made significant progress in adopting SMR which allows us to increase storage density and overall storage capacity without impacting footprint. SMR drives now account for over 80% of storage server capacity and the firm is also increasing efficiency by moving data centers to lower-cost locations.
Guidance
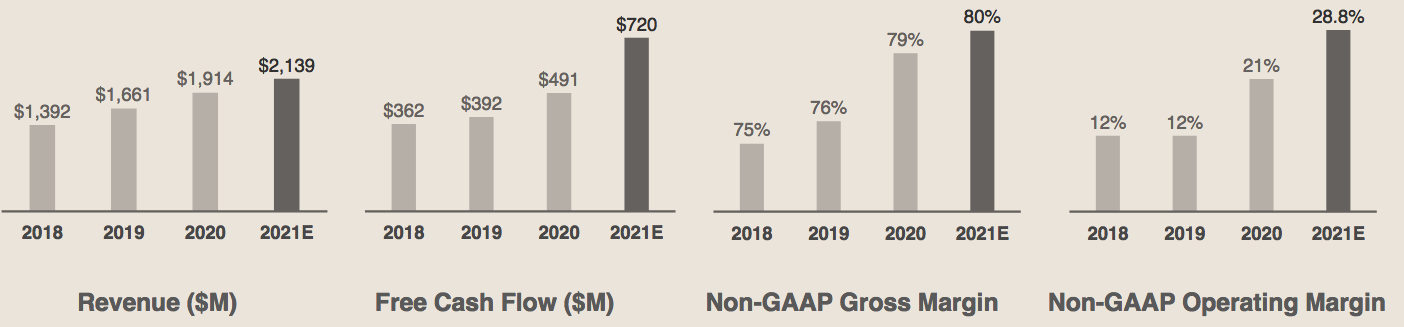
For FY21, te company is raising its revenue guidance range, which was previously $2.118 billion, to $2.130 billion to $2.136 billion to $2.142 billion, or up 12% to 17% from FY20.
| Fiscal period |
Revenue in $ million |
Y/Y growth | Net loss in $ million |
| 2015 | 603.8 | NA | (352.9) |
| 2016 | 844.8 | 40% | (210.2) |
| 2017 | 1,107 | 13% | (111.7) |
| 2018 | 1,392 | 26% | (484.9) |
| 2019 |
1,661 | 19% | (52.7) |
| 2020 |
1,914 | 15% | (256.3) |
| 1Q21 |
511.6 | 12% | 47.6 |
| 2Q21 |
530.6 | 14% | 88.0 |
| 2021 (estim.) |
2,236-2,142 | 12%-17% | NA |


 Subscribe to our free daily newsletter


