


 Box: Fiscal 3Q24 Financial Results
About same revenue and net income as former quarter, to surpass sales of $1 billion in FY24
This is a Press Release edited by StorageNewsletter.com on December 11, 2023 at 2:02 pm| (in $ million) | 3Q23 | 3Q24 | 9 mo. 23 | 9 mo. 24 |
| Revenue | 250.0 | 261.5 | 734.4 | 774.9 |
| Growth | 5% | 6% | ||
| Net income (loss) | 9.9 | 10.7 | 6.3 | 29.8 |
Box, Inc. announced preliminary financial results for the third quarter of fiscal year 2024, which ended October 31, 2023.
“We continue to execute on our Content Cloud strategy, creating the only end-to-end platform that can help customers power their complete content lifecycle in a single architecture,” said Aaron Levie, co-founder and CEO. “By demonstrating our product leadership with Box AI and Box Hubs, we are delivering the platform that customers need to meet the demands of the rapidly evolving era of AI-powered work.”
“Our focus on delivering profitable growth drove operating margin expansion and grew earnings per share 16% Y/Y,” said Dylan Smith, co-founder and CFO. “The successful execution of our public cloud migration coupled with the savings we’ve generated through our continued focus on cost discipline enables us to invest in product innovation to drive durable, long-term growth.”
3FQ24 Highlights
3FQ24 gross profit, operating income, and earnings per share include a headwind vs. the company’s expense forecast of $3.3 million from an anticipated decrease in proceeds from the sale of certain data center equipment as the company completes its migration to the public cloud.
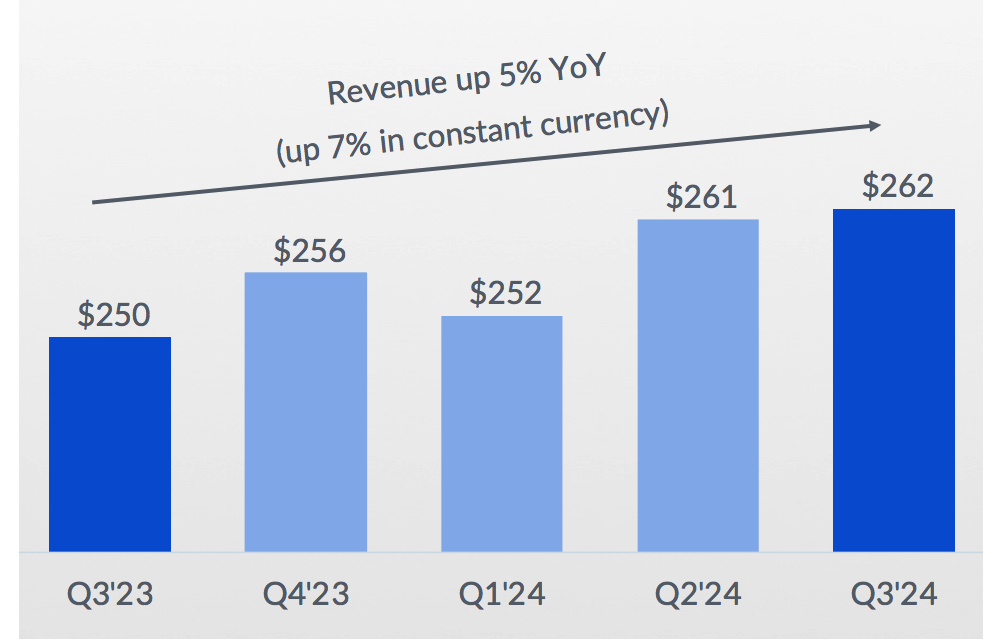
• Revenue was $261.5 million, a 5% increase from revenue for 3FQ23 of $250.0 million, or 7% growth on a constant currency basis.
• Remaining performance obligations as of October 31, 2023 were $1.131 billion, a 7% increase from RPO as of October 31, 2022 of $1.056 billion, or 8% growth on a constant currency basis.
• Billings were $253.7 million, a 2% decrease, as reported and in constant currency, from billings for the 3FQ23 of $258.2 million.
• GAAP gross profit was $192.3 million, or 73.5% of revenue. This compares to a GAAP gross profit of $185.5 million, or 74.2% of revenue, in 3FQ23. The equipment proceeds headwind represents an impact of 130 basis points to GAAP gross margin.
• Non-GAAP gross profit was $199.6 million, or 76.3% of revenue. This represents 4% growth from non-GAAP gross profit of $191.2 million, or 76.5% of revenue, in 3FQ23. The equipment proceeds headwind represents an impact of 130 basis points to non-GAAP gross margin.
• GAAP operating income was $11.4 million, or 4.4% of revenue. This compares to a GAAP operating income of $13.4 million, or 5.3% of revenue, in 3FQ23. The equipment proceeds headwind represents an impact of 130 basis points to GAAP operating margin.
• Non-GAAP operating income was $64.6 million, or 24.7% of revenue. This represents 8% growth from non-GAAP operating income of $60.0 million, or 24.0% of revenue, in 3FQ23. The equipment proceeds headwind represents an impact of 130 basis points to non-GAAP operating margin.
• GAAP diluted net income per share attributable to common stockholders was $0.04 on 147.6 million weighted-average shares outstanding. This compares to GAAP diluted net income per share attributable to common stockholders of $0.03 in 3FQ23 on 148.1 million weighted-average shares outstanding. GAAP net income per share attributable to common stockholders includes a negative impact of $0.05 Y/Y from unfavorable foreign exchange rates. The equipment proceeds headwind represents an impact of $0.02 to GAAP diluted net income per share.
• Non-GAAP diluted net income per share attributable to common stockholders was $0.36. This compares to non-GAAP diluted net income per share attributable to common stockholders of $0.31 in 3FQ23. Non-GAAP net income per share attributable to common stockholders includes a negative impact of $0.05 Y/Y from unfavorable foreign exchange rates. The equipment proceeds headwind represents an impact of $0.02 to non-GAAP diluted net income per share.
• Net cash provided by operating activities was $71.8 million, a 3% increase from net cash provided by operating activities of $69.7 million in 3FQ23.
• Non-GAAP free cash flow was $58.3 million, a 6% increase from non-GAAP free cash flow of $55.0 million in 3FQ23.
Outlook
As a reminder, approximately one third of company’s revenue is generated outside USA, of which approximately 60% is in Japanese Yen. The following guidance includes the expected impact of FX headwinds, assuming present foreign currency exchange rates.
As discussed above, the 3FQ24 and FY24 gross profit, operating income, and diluted net income per share include a headwind vs. the company’s expense forecast of approximately $4 million and $7 million respectively, from an anticipated decrease in proceeds from the sale of certain data center equipment as the company completes its migration to the public cloud. Additionally, in 3FQ24, the firm modified its Redwood City office lease to reduce the amount of square footage, creating a one-time expense of $1.6 million that will be recognized in 4FQ24
4FQ24 guidance
• Revenue is expected to be in the range of $262 million to $264 million, up 3% Y/Y at the high-end of the range, or 5% growth on a constant currency basis.
• GAAP operating margin is expected to be 5.0%, and non-GAAP operating margin is expected to be 25.5%. The equipment proceeds headwind represents an impact of 150 basis points to both GAAP and non-GAAP operating margin. The lease modifications discussed above represent a GAAP and non-GAAP operating margin headwind of 60 basis points.
• GAAP net income per share attributable to common stockholders is expected to be in the range of $0.05 to $0.06. GAAP EPS guidance includes an expected negative impact of $0.03 from unfavorable exchange rates. The equipment proceeds headwind represents an impact of $0.02 to GAAP diluted net income per share. The lease modifications discussed above represent a $0.01 impact to GAAP diluted net income per share.
• Non-GAAP diluted net income per share attributable to common stockholders is expected to be in the range of $0.38 to $0.39. Non-GAAP EPS guidance includes an expected negative impact of $0.03 from unfavorable exchange rates. The equipment proceeds headwind represents an impact of $0.02 to non-GAAP diluted net income per share. The lease modifications discussed above represent a $0.01 impact to non-GAAP diluted net income per share.
• Weighted-average diluted shares outstanding are expected to be approximately 147 million.
FY24 guidance
• Revenue is expected to be in the range of $1.037 billion to $1.039 billion, up 5% Y/Y at the high-end of the range, or 8% growth on a constant currency basis.
• GAAP operating margin is expected to be approximately 4.0%, and non-GAAP operating margin is expected to be 24.5%. The equipment proceeds headwind represents an impact of 70 basis points to both GAAP and non-GAAP operating margin. The lease modifications discussed above represent a GAAP and non-GAAP operating margin headwind of 15 basis points.
• GAAP net income per share attributable to common stockholders is expected to be in the range of $0.15 to $0.16. FY24 GAAP EPS guidance includes an expected negative impact of $0.17 from unfavorable exchange rates. The equipment proceeds headwind represents an impact of $0.04 to GAAP diluted net income per share. The lease modifications discussed above represent a $0.01 impact to GAAP diluted net income per share.
• Non-GAAP diluted net income per share attributable to common stockholders is expected to be in the range of $1.42 to $1.43. FY24 non-GAAP EPS guidance includes an expected negative impact of $0.17 from unfavorable exchange rates. The equipment proceeds headwind represents an impact of $0.04 to non-GAAP diluted net income per share. The lease modifications discussed above represent a $0.01 impact to non-GAAP diluted net income per share.
• Weighted-average diluted shares outstanding are expected to be 148.5 million.
Comments
In 3FQ24, the company delivered revenue growth in line with guidance, with Y/Y growth of 5% at $262 million, or 7% in constant currency.
In this quarter, it continued to deliver profitable growth while expanding operating margin and executing its disciplined capital allocation strategy.
It marked 5th consecutive quarter of achieving GAAP profitability.
Revenue growth driven by Suites momentum
Customers increasingly adopting Suites
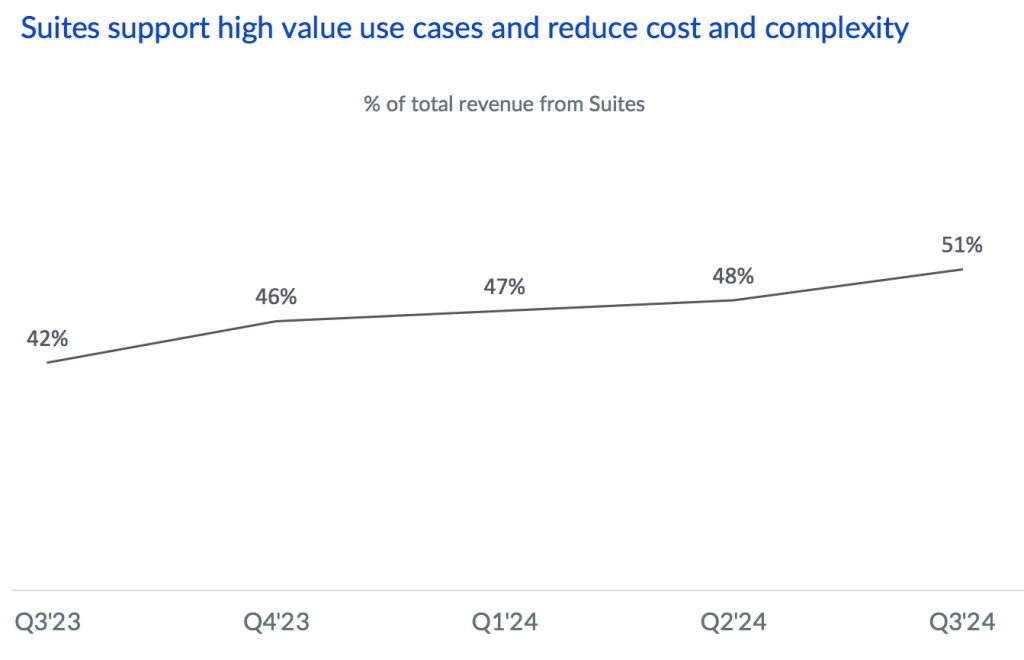
Momentum with Enterprise Plus remains strong, and the firm has now reached 51% of its revenue coming from Suites customers, up from 48% last quarter.
It now has over 1,700 total customers paying more than $100,000 annually, an increase of 10% Y/Y.
Suites attach rate of 79% in large 3FQ24 deals was up from 73% in 3FQ23. Suites customers now account for 51% of revenue, up from 42% of revenue a year ago and up from 48% in 2FQ24.
Approximately one third of revenue is generated outside of USA, with roughly 60% of international revenue coming from Japan.
Box currently expects its FY25 reported revenue growth rate to be approximately 5%. This includes an expected headwind from FX of roughly 100 basis points.
It remains committed to delivering vs. the long-term financial targets that it outlined at its March financial analyst day. It is reiterating its long-term revenue growth target of 10 to 15%, gross margin of 80 to 82%, operating margin of 32 to 35%, and revenue growth plus free cash flow margin of at least 45%.
Revenue and net income (loss) in $million
| Period | Revenue | Y/Y growth | Net income (loss) |
| FY11 | 21.1 | NA | (53.3) |
| FY12 | NA | NA | NA |
| FY13 | 58.8 | NA | (112.6) |
| FY14 | 124.2 | 112% | (168.6) |
| FY15 | 216.4 | 74% | (168.2) |
| FY16 | 302.7 | 40% | (202.9) |
| FY17 | 398.6 | 32% | (150.8) |
| FY18 | 506.1 | 27% | (155.0) |
| FY19 | 608.4 | 20% | (134.6) |
| FY20 | 696.2 | 14% | (144.3) |
| FY21 | 770.8 | 11% | (43.4) |
| FY22 | 192.3 | 11% | (7.7) |
| FY23 | 990.9 | 13% | 26.8 |
| 1FQ24 | 251.9 | 6% | (8.3) |
| 2FQ24 | 261.4 | 6% | 10.8 |
| 3FQ24 | 261.5 | 5% | 10.7 |
| 4FQ24 (estim.) | 262-264 | 2%-3% | NA |
| FY24 (estim.) |
1,037-1,039 | 5% | NA |
Note: IPO in 2015 raising $175 million


 Subscribe to our free daily newsletter


