


 Box: Fiscal 2FQ24 Financial Results
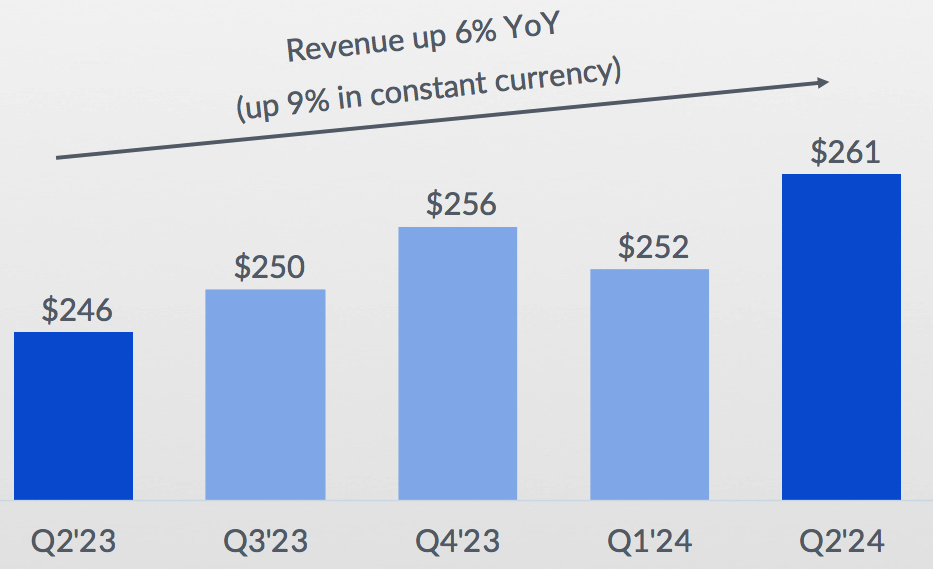
Revenue of $261 million up 6% Y/Y, 4% Q/Q, and back to profit
This is a Press Release edited by StorageNewsletter.com on August 31, 2023 at 2:02 pm| (in $ million) | 2Q23 | 2Q24 | 6 mo. 23 | 6 mo. 24 |
| Revenue | 246.0 | 261.4 | 484.4 | 513.3 |
| Growth | 6% | 6% | ||
| Net income (loss) | 1.0 | 10.8 | (3.7) | 19.1 |
- GAAP Operating Margin of 4%, Non-GAAP Operating Margin of 25%, Both Exceeding Guidance
- Cash From Operations of $33 Million, up 15% Y/Y
- Free Cash Flow of $21 Million, up 15% Y/Y
- Expands Stock Repurchase Program by $100 Million
Box, Inc. announced preliminary financial results for the second quarter of fiscal year 2024, which ended July 31, 2023.
“As enterprises continue to make IT decisions around strategic imperatives and the role of AI, they are turning to Box’s Content Cloud to help transform how they work and get even more value out of their data,” said Aaron Levie, co-founder and CEO. “The Box platform enables enterprises to drive productivity across the business, simplifies IT and optimizes spend, and protects their most important data. With Box AI, we will be able to securely connect customer’s enterprise content with the world’s leading AI models, uniquely positioning Box at the center of the future of work.“
“We were pleased to deliver 2FQ24 revenue growth of 6% Y/Y, or 9% in constant currency. Continued focus on operational discipline resulted in 2FQ24 operating margins and EPS above our expectations, as we delivered our fourth consecutive quarter of GAAP profitability,” said Dylan Smith, co-founder and CFO. “While ongoing economic factors have affected our customers’ IT budgets and put pressure on our projected FY24 growth rate, we remain committed to our long-term revenue growth targets as we continue to drive gross margin and operating margin expansion in FY24 and beyond.”
2FQ24 Financial Highlights
• Revenue was $261.4 million, a 6% increase from revenue for 2FQ23 of $246.0 million, or 9% growth on a constant currency basis.
• Remaining performance obligations (RPO) as of July 31, 2023 were $1.138 billion, an 8% increase from remaining performance obligations as of July 31, 2022 of $1.051 billion, or 11% growth on a constant currency basis.
• Billings were $232.5 million, a 1% decrease from billings for 2FQ23 of $235.0 million, or 1% growth on a constant currency basis.
• GAAP gross profit was $194.4 million, or 74.4% of revenue. This compares to a GAAP gross profit of $181.2 million, or 73.6% of revenue, in 2FQ23.
• Non-GAAP gross profit was $201.1 million, or 76.9% of revenue. This represents 7% growth from non-GAAP gross profit of $187.4 million, or 76.2% of revenue, in 2FQ23.
• GAAP operating income was $9.9 million, or 3.8% of revenue. This compares to a GAAP operating income of $3.1 million, or 1.3% of revenue, in 2FQ23.
• Non-GAAP operating income was $64.7 million, or 24.8% of revenue. This represents 21% growth from non-GAAP operating income of $53.3 million, or 21.7% of revenue, in 2FQ23.
• GAAP diluted net income per share attributable to common stockholders was $0.04 on 150.0 million weighted-average shares outstanding. This compares to GAAP diluted net loss per share attributable to common stockholders of $0.02 in 2FQ23 on 143.7 million weighted-average shares outstanding. GAAP net income per share attributable to common stockholders in 2FQ24 includes a negative impact of $0.04 from unfavorable foreign exchange rates.
• Non-GAAP diluted net income per share attributable to common stockholders was $0.36. This compares to non-GAAP diluted net income per share attributable to common stockholders of $0.28 in 2FQ23. Non-GAAP net income per share attributable to common stockholders in 2FQ24 includes a negative impact of $0.04 from unfavorable foreign exchange rates.
• Net cash provided by operating activities was $32.7 million, a 15% increase from net cash provided by operating activities of $28.3 million in 2FQ23.
• Non-GAAP free cash flow was $20.6 million, a 15% increase from non-GAAP free cash flow of $18.0 million in 2FQ23.
On August 28, 2023, the board of directors authorized an expansion of its stock repurchase program by $100 million. During 2FQ24, the company repurchased 2.2 million shares of its Class A common stock at a weighted average price of $28.55 for a total of $62 million.
3FQ24 guidance
• Revenue is expected to be in the range of $261 million to $263 million, up 5% Y/Y at the high-end of the range, or 7% growth on a constant currency basis.
• GAAP operating margin is expected to be approximately 4.5%, and non-GAAP operating margin is expected to be approximately 25.5%.
• GAAP net income per share attributable to common stockholders is expected to be in the range of $0.03 to $0.04. GAAP EPS guidance includes an expected negative impact of $0.04 from unfavorable exchange rates.
• Non-GAAP diluted net income per share attributable to common stockholders is expected to be in the range of $0.37 to $0.38. Non-GAAP EPS guidance includes an expected negative impact of $0.04 from unfavorable exchange rates.
• Weighted-average diluted shares outstanding are expected to be approximately 149 million.
FY24 Guidance
• Revenue is expected to be in the range of $1.040 billion to $1.044 billion, up 5% Y/Y at the high-end of the range, or 8% growth on a constant currency basis.
• GAAP operating margin is expected to be approximately 4.5%, and non-GAAP operating margin is expected to be 25.5%.
• GAAP net income per share attributable to common stockholders is expected to be in the range of $0.17 to $0.21. FY24 GAAP EPS guidance includes an expected negative impact of $0.17 from unfavorable exchange rates.
• Non-GAAP diluted net income per share attributable to common stockholders is expected to be in the range of $1.46 to $1.50. This represents an increase on the low end from Box’s previous guidance provided on May 30, 2023, which was $1.44 to $1.50. FY24 non-GAAP EPS guidance includes an expected negative impact of $0.17 from unfavorable exchange rates.
• Weighted-average diluted shares outstanding are expected to be approximately 150 million.
Comments
In the quarter, Box generated revenue of $261 million, up 6% Y/Y (or 4% Q/Q) and representing 9% yearly growth on a constant currency basis.
It now has nearly 1,700 total customers paying more than $100,000 annually, an increase of 11% Y/Y.
Revenue growth driven by Suites momentum
Firm's suites attach rate of 78% in large 2FQ24 deals, a notable improvement from 72% in the year ago period demonstrates the value that company's Content Cloud platform is delivering to its large customers. Suites customers now account for 48% of revenue, up 20% from 40% of revenue a year ago and after introducing suites 4 years ago.
In 2FQ24, Enterprise Plus was well over 90% of Suite sales in large deals and suites comprised over 78% of deals over $100,000.
2FQ24 billings of $233 million were down 1% Y/Y and up 1% on a constant currency basis. As anticipated, they were impacted by a particularly high volume of early renewals in 1FQ24. They were also impacted by incremental FX headwinds from the U.S. dollar to Japanese yen exchange rate of approximately $2 million or 100 basis points.
Revenue and net income (loss) in $million
| Period | Revenue | Y/Y growth | Net income (loss) |
| FY11 | 21.1 | NA | (53.3) |
| FY12 | NA | NA | NA |
| FY13 | 58.8 | NA | (112.6) |
| FY14 | 124.2 | 112% | (168.6) |
| FY15 | 216.4 | 74% | (168.2) |
| FY16 | 302.7 | 40% | (202.9) |
| FY17 | 398.6 | 32% | (150.8) |
| FY18 | 506.1 | 27% | (155.0) |
| FY19 | 608.4 | 20% | (134.6) |
| FY20 | 696.2 | 14% | (144.3) |
| FY21 | 770.8 | 11% | (43.4) |
| FY22 | 192.3 | 11% | (7.7) |
| FY23 | 990.9 | 13% | 26.8 |
| 1FQ24 | 251.9 | 6% | (8.3) |
| 2FQ24 | 261.4 | 6% | 10.8 |
| 3FQ24 (estim.) | 261-263 | 5% | NA |
| FY24 (estim.) |
1,040-1,044 | 5% | NA |
Note: IPO in 2015 raising $175 million


 Subscribe to our free daily newsletter


