


 Pure Storage: Fiscal 1Q24 Financial Results
Main figures down
This is a Press Release edited by StorageNewsletter.com on June 5, 2023 at 2:02 pm| (in $ million) | 1Q23 | 1Q24 | Growth |
| Revenue |
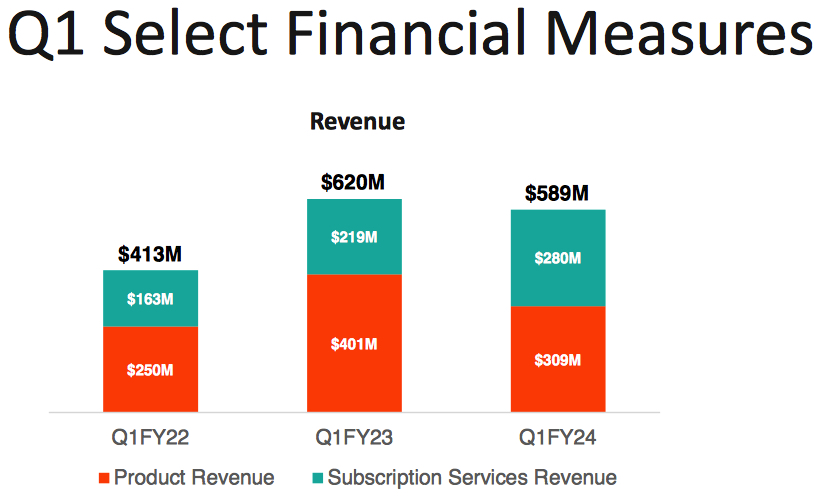
620.4 | 589.3 | -5% |
| Net income (loss) | (11.5) | (67.4) |
Pure Storage, Inc. announced financial results for its first quarter fiscal 2024 ended May 7, 2023.
“We are the clear leader in storage, now delivering a portfolio that can address the vast majority of storage needs for all enterprises,” said Charles Giancarlo, chairman and CEO. “The superior economics, performance, and operational and environmental efficiencies of Pure’s product portfolio over both HDD and SSD-based, all-flash competitive offerings are now undeniable.”
1FQ24 highlights
• Revenue $589.3 million, a decrease of 5% Y/Y, and an increase of 5% Y/Y when excluding the impact of $60 million of 1FQ23 product revenue that was contemplated in 2H23
• Subscription services revenue $280.3 million, up 28% Y/Y
• Subscription annual recurring revenue (ARR) $1.2 billion, up 29% Y/Y
• Remaining performance obligations (RPO) $1.8 billion, up 26% Y/Y
• GAAP gross margin 70.1%; non-GAAP gross margin 72.2%
• GAAP operating loss $(71.8) million; non-GAAP operating income $19.6 million
• GAAP operating margin (12.2)%; non-GAAP operating margin 3.3%
• Operating cash flow $173.2 million; free cash flow $121.8 million
• Total cash, cash equivalents, and marketable securities $1.2 billion
• Returned approximately $70 million in 1FQ24 to stockholders through share repurchases of 2.9 million shares
• Repaid $575 million of outstanding convertible senior notes
“Through innovation, our competitive differentiation is unmatched in providing both high business value and lower TCO benefits across our portfolio to our customers,” said Kevan Krysler, CFO. “Subscription services ARR grew 29%, with strong momentum from our record Evergreen//One subscription sales this quarter.“
Comments
For their more recent financial quarters and for their AFA business only:
- NetApp records annual revenue run rate of -4% from 1FQ22, with $3.1 billion in 4FQ23, up 11% Q/Q,
- Dell PowerStore has grown for 11 consecutive quarters since its release,
- For HPE, total AFA growth was 20% Y/Y,
- For Pure Storage, totally involved in AFA, revenue reached $589.3 million, a decrease of 5% Y/Y, and an increase of 5% Y/Y.
Last quarter, Pure estimated to reach revenue in 1FQ24 of $560 million or -10% Y/Y. It was finally more than that, but down 5% Y/Y and 27% Q/Q, and the company is back to loss ($76 million, the worst figure since 1FQ22).
Subscription services ARR grew 29% Y/Y to $1.2 billion, and subscription services revenue was $280 million represented 48% of total revenue.
Highlights for the quarter include the highest all-time sales for Evergreen//One, first sales of FlashBlade//E, which is experiencing the fastest first quarter pipeline growth for any new Pure product.
CEO did a prediction: "The days of hard disks are coming to an end. We predict that there will be no new hard disks sold in 5 years."
He also said: "Compared to our all-flash competitors, we are 10x more reliable. We are 2x to 5x more power and space efficient, and we require 5 to 10x less manual labor to operate, resulting overall in at least 50% lower TCO."
As noted in previous earnings calls, revenue last year included $60 million of product revenue that was contemplated in the second half of last year. Excluding this impact, 1FQ24 total revenue grew approximately 5% with US revenue at $427 million, and international revenue at $162 million.
Headcount increased slightly to 5,270 employees.
The firm hopes to reach revenue of $680 million in 2FQ24, up 5% Y/Y or 14% Q/Q.
Like last quarter, company's FY24 guidance for sales is projected to be "in mid to high single digit growth Y/Y."
Revenue in $ million
(FY ended in January)
| Period | Revenue | Y/Y growth | Net income (loss) |
| FY13 | 6.1 | NA | (23.4) |
| FY14 | 42.7 | 603% | (78.6) |
| FY15 | 174.5 | 308% | (183.2) |
| FY16 | 440.3 | 152% | (213.8) |
| FY17 | 728.0 | 65% | (245.1) |
| FY18 |
1,023 | 41% |
(159.9) |
| FY19 |
1,360 | 33% |
(178.4) |
| FY20 |
1,643 | 21% | (201.0) |
| FY21 |
1,684 | 2% |
(282.1) |
| 1F22 |
412.7 | 12% |
(84.2) |
| 2F22 |
496.8 | 23% |
(45.3) |
| 3F22 |
562.7 | 29% |
(28.7) |
| 4F22 |
708.6 | 41% |
14.9 |
| FY22 |
2,181 |
30% |
(143.3) |
| 1F23 | 620.4 | 50% |
(11.5) |
| 2F23 |
646.8 | 30% |
10.9 |
| 3F23 |
676.1 | 20% | (0.8) |
| 4F23 |
810.2 | 14% | 74.5 |
| FY23 |
2,753 |
26% |
73.1 |
| 1Q24 |
589.3 |
-5% |
(67.4) |
| 2Q24* | 680 |
5% |
NA |
| FY24* |
Mid to high single digit growth Y/Y | NA |
* Estimations


 Subscribe to our free daily newsletter


