


 Pure Storage: Fiscal 3Q23 Financial Results
Revenue growth of 20% Y/Y and 5% Q/Q, back to tiny loss
This is a Press Release edited by StorageNewsletter.com on December 2, 2022 at 2:01 pm| (in $ million) | 3Q22 | 3Q23 | 9 mo. 22 | 9 mo. 23 |
| Revenue | 562.7 | 676.1 | 1,472 | 1,943 |
| Growth | 20% | 32% | ||
| Net income (loss) | (28.7) | (0.8) | (158.2) | (1.4) |
Pure Storage, Inc. announced financial results for its fiscal third quarter ended November 6, 2022.
“An ever growing number of customers around the world trust Pure to provide the most advanced, reliable, and energy-efficient technology to satisfy their mission-critical data storage and management needs,” said Charles Giancarlo, chairman and CEO. “With the power of our unique flash-optimized technology and differentiated business model, we look forward to managing increasingly more of their data storage requirements.“
3FQ23 Financial Highlights
- Revenue $676.0 million, up 20% Y/Y
- Subscription services revenue $244.8 million, up 30% Y/Y
- Subscription Annual Recurring Revenue (ARR) $1.0 billion, up 30% Y/Y
- Remaining Performance Obligations (RPO) $1.6 billion, up 26% Y/Y
- GAAP gross margin 69.0%; non-GAAP gross margin 70.9%
- GAAP operating income $9.1 million; non-GAAP operating income $107.2 million
- GAAP operating margin 1.4%; non-GAAP operating margin 15.9%
- Operating cash flow $154.7 million; free cash flow $114.8 million
- Total cash, cash equivalents, and marketable securities $1.5 billion
- Returned approximately $24.5 million in 3FQ23 to stockholders, repurchased 888,000 shares
“Through solid execution, we delivered strong financial results in 3FQ23 by growing revenue 20% and increasing our operating profits,” said Kevan Krysler, CFO. “Our leadership in flash management, enabled with our software, and declining cost of flash is accelerating our progress in replacing traditional disk solutions and substantially reducing data center energy consumption.”
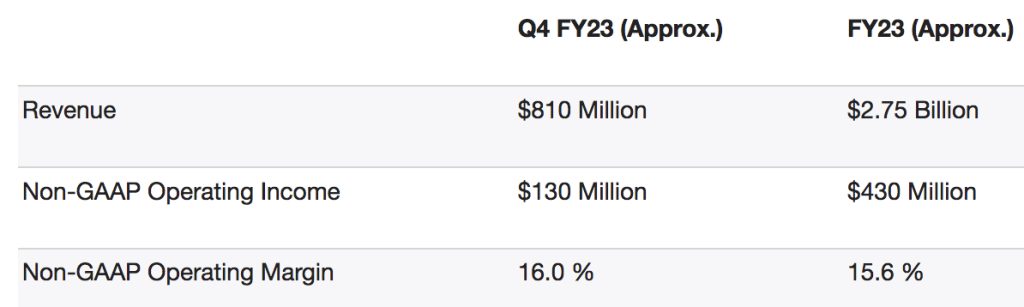
Guidance
Comments
Among the biggest storage companies, Pure, in AFAs only, is the fastest growing one with more than 20% Q/Q sales since 2FQ22, but far to be the most profitable.
With revenue of $676.1 million for the quarter, up 20% Y/Y and 5% Q/Q, the company exceeds guidance of $670 million as expected 3 months ago, but is back to tiny loss ($0.8 million) vs. profit of $10.9 million in 2FQ23.
Stock climbed 1.8% to $29.70 during after-hours trading on the stock market.
Product revenue grew 15%, and subscription services revenue increased 30%, comprising 36% of total revenue for the quarter.
Subscription annual recurring revenue (ARR) exceeded $1 billion this quarter, growing 30% Y/Y. Record sales of Evergreen//One in 3FQ23 represent a key driver of Subscription ARR growth.
Revenue performance, growth, and demand of our FlashArray//C, and
FlashBlade//S solutions, both leveraging QLC flash, were strong this
quarter
Total new customers
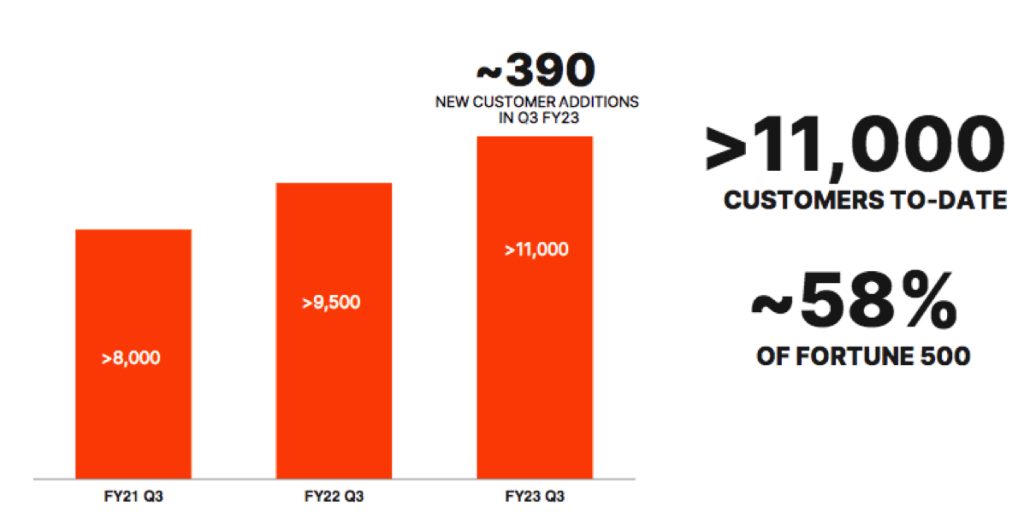
Customers, which now exceed 11,000, and represent 58% of the Fortune 500. The manufacturer acquired 390 new customers in 3FQ23, including across the telecom industry.
Headcount has increased to nearly 4,900 employees
CEO commented: "NAND cost per bit continues to approach that of magnetic disks. Because of Pure's unique IP, Pure QLC-based systems are now competitive with hybrid disk based systems on a price per bit level, years ahead of the commodity crossover point. We expect that the currently anticipated improvements in Pure's NAND economics this coming year will enable Pure to deliver our QLC-based products at prices competitive with most near-line disk arrays on a TCO basis. We believe strongly that the days of the hard disk in the data center are over."
For FY23, guidance does not change: $2.75 billion. For 4FQ23, $810 is expected or up 20% Q/Q and 14% Y/Y.
Revenue in $ million
(FY ended in January)
| Period | Revenue | Y/Y growth | Loss |
| FY13 | 6.1 | NA | (23.4) |
| FY14 | 42.7 | 603% | (78.6) |
| FY15 | 174.5 | 308% | (183.2) |
| FY16 | 440.3 | 152% | (213.8) |
| FY17 | 728.0 | 65% | (245.1) |
| FY18 |
1,023 | 41% |
(159.9) |
| FY19 |
1,360 | 33% |
(178.4) |
| FY20 |
1,643 | 21% | (201.0) |
| FY21 |
1,684 | 2% |
(282.1) |
| 1F22 |
412.7 | 12% |
(84.2) |
| 2F22 |
496.8 | 23% |
(45.3) |
| 3F22 |
562.7 | 29% |
(28.7) |
| 4F22 |
708.6 | 41% |
14.9 |
| FY22 |
2,181 |
30% |
(143.3) |
| 1F23 | 620.4 | 50% |
(11.5) |
| 2F23 |
646.8 | 30% |
10.9 |
| 3F23 |
676.1 | 20% | 0.8 |
| 4F23* |
810 | 20% |
NA |
| FY23* |
∼2,750 |
∼26% |
NA |
* Estimations


 Subscribe to our free daily newsletter


