


Seagate: Fiscal 2Q23 Financial Results
Awful quarter with sales from $3.1 billion to $1.9 billion Y/Y and first net loss since long time
This is a Press Release edited by StorageNewsletter.com on January 27, 2023 at 2:02 pm| (in $ million) | 3Q22 | 3Q23 | 9 mo. 22 | 9 mo. 23 |
| Revenue | 3,116 | 1,887 | 6,231 | 3,922 |
| Growth | -49% | -47% | ||
| Net income (loss) | 501 | (33) | 1,027 | (4) |
Seagate Technology Holdings plc reported financial results for its fiscal second quarter ended December 30, 2022.
“Seagate is effectively managing through a tough macroeconomic environment. In the December quarter, we delivered revenue and non-GAAP EPS slightly above our guidance midpoint and extended a decade long trend of generating positive free cash flow,” said Dave Mosley, CEO. “We are executing our industry leading product roadmap, which positions us well as the markets ultimately recover. We expect to launch our 30+TB HAMR-based product family in the June quarter enabled by 3/+TB per disk densities.”
During 2FQ23 the company generated $251 million in cash flow from operations and $172 million in free cash flow, and paid cash dividends of $145 million. It reduced debt by $220 million, exiting the fiscal second quarter with total debt of $6.0 billion, and cash and cash equivalents of $770 million. There were 206 million ordinary shares issued and outstanding as of the end of the quarter.
In 2FQ23, it recognized charges related to the October 2022 restructuring plan, in addition to various gains and charges associated with other cost saving initiatives. These items are reflected in the GAAP results, but excluded from the non-GAAP results.
Quarterly Cash Dividend
The board of directors declared a quarterly cash dividend of $0.70 per share, which will be payable on April 6, 2023 to shareholders of record as of the close of business on March 22, 2023. The payment of any future quarterly dividends will be at the discretion of the board and will be dependent upon firm’s financial position, results of operations, available cash, cash flow, capital requirements and other factors deemed relevant by the board.
Business outlook for 3FQ22
• Revenue of $2.0 billion, ±$150 million, up about 6% Q/Q at midpoint.
• Non-GAAP diluted EPS of $0.25, plus or minus ±$0.20
Comments
This quarter, the company was deeply impacted by the very large decrease of the WW HDD market in the last 3-month of 2022.
Revenue at $1.9 billion came in slightly above the midpoint of guidance range ($1.85 billion, ±$150 million), down 49% Y/Y and 8% Q/Q.
Stock soar 10.9%, closing at $69.01.
Relative to market conditions, 3 primary external factors have been impacting business over the past several months. The Covid-related economic slowdown in China, the work down of nearline HDD inventories among US cloud and global enterprise customers under a more cautious demand environment, and macro-related disruptions primarily impacting consumer-facing markets.
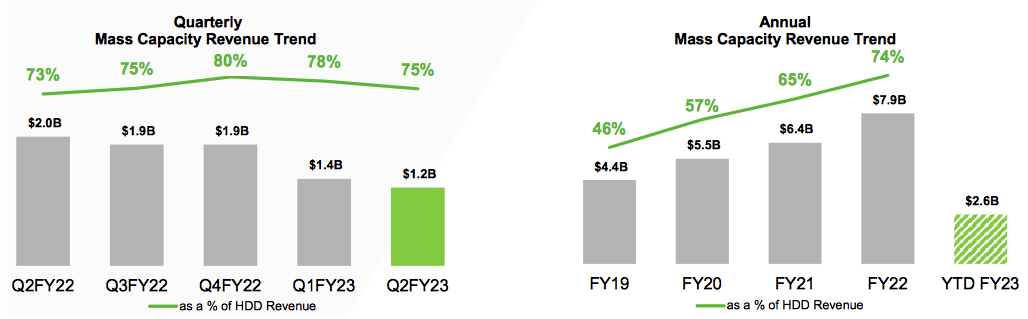
These factors remained at play during 2FQ23 and weighed heavily on the mass capacity markets, resulting in a 10% sequential decline in mass capacity revenue.
HDD products trend
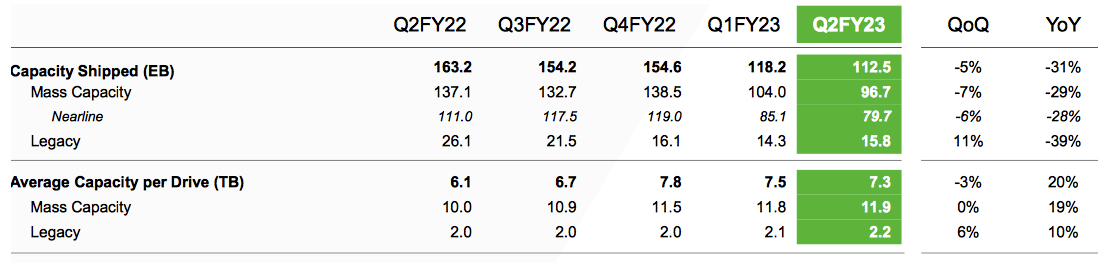
Total HDD shipments were 113EB in 2FQ23, down 5% Q/Q, with HDD revenue declining 6% sequentially to $1.7 billion.
Mass capacity sales were offset by a slight seasonal improvement in the legacy market. Shipment into mass capacity markets totaled 97EB, down 7% Q/Q. Of this total, 82% were derived from nearline products, shifting to cloud and enterprise OEMs. Nearline shipments of 80EB were down 6% Q/Q and roughly 30% of firm's recent high.
On a revenue basis, mass capacity sales were $1.2 billion, reflecting the nearline trend, as well as lower demand in the VIA market.
20+TB family of nearline products, which represented close to 60% of nearline exabyte shipments in 2FQ23 and is expected to trend even higher in 3FQ23.
20TB product features 2TB/disk capacities and Seagate have started to ramp the volume of 22TB products deployed on 2.2TB/disk capacities. The 20+TB platform is based on traditional PMR technology. And some customers are choosing to enable SMR technology as an additional feature that slightly increases the drives capacity for certain applications.
In 2FQ23, about 35% of nearline exabyte shipments were deployed as SMR drives. The manufacturer is executing plans to deliver another 10% gain in per disk capacity for this PMR platform to offer drives in the mid- to upper 20TB range. It was nearly 4 years ago to the day that the firm first shared our lab results demonstrating 3TB/disk capacity.
It has demonstrated capacities of 4TB/disk in its recording physics labs. In the current market environment, it been taking advantage of its reduced factory utilization to accelerate cycles of learning around HAMR productization. It will be shipping pre-qualification units to key cloud customers in the coming weeks. It now expect to launch its 30+TB platform in the June quarter, slightly ahead of schedule.
Within the legacy market, revenue was $421 million, up 8% Q/Q, primarily driven by a seasonal uptick in consumer demand, although a more subdued level compared to prior year.
Finally, revenue for our non-HDD business was $224 million, down 15% sequentially, reflecting the expected decline in enterprise system business following a very strong September quarter.
While system sales were down sequentially off of a very strong September quarter, the company captured a record number of new customer wins with its Corvault products.
HDDs from 1FQ16 to 2FQ23
| Fiscal period | HDD ASP | Exabytes shipped |
Average GB/drive |
| 1Q16 | $58 | 55.6 | 1,176 |
| 2Q16 | $59 | 60.6 | 1,320 |
| 3Q16 | $60 | 55.6 | 1,417 |
| 4Q16 | $67 | 61.7 | 1,674 |
| 1Q17 | $67 | 66.7 | 1,716 |
| 2Q17 | $66 | 68.2 | 1,709 |
| 3Q17 | $67 | 65.5 | 1,800 |
| 4Q17 | $64 | 62.2 | 1,800 |
| 1Q18 | $64 | 70.3 | 1,900 |
| 2Q18 | $68 | 87.5 | 2,200 |
| 3Q18 | $70.5 | 87.4 | 2,400 |
| 4Q18 |
$72 | 92.9 | 2,500 |
| 1Q19 | $70 | 98.8 | 2,500 |
| 2Q19 |
$68 | 87.4 | 2,400 |
| 3Q19 |
$72 | 76.7 | 2,400 |
| 4Q19 | $79.7 | 84.5 | 2,700 |
| 1Q20 |
$81 | 98.3 | 2,900 |
| 2Q20 |
$77 | 106.9 | 3,300 |
| 3Q20 | $86 | 120.2 | 4,100 |
| 4Q20 |
$89 | 117.0 | 4,500 |
| 1Q21 |
$82 | 114.0 | 4,400 |
| 2Q21 |
$81 | 129.2 | 4,300 |
| 3Q21 | $91 | 139.6 | 5,100 |
| 4Q21 | $97 | 152.3 | 5,400 |
| 1Q22 |
$103 | 159.1 | 5,700 |
| 2Q22 |
$106 | 163.2 | 6,100 |
| 3Q22 |
NA | 154.2 | 6,700 |
| 4Q22 |
NA | 154.6 | 7,800 |
| 1Q23 |
$104 | 118.2 | 7,500 |
| 2Q23 |
$108 | 113 | 7,300 |
FY ending in June
* in $million
| Period | Revenue* | Y/Y growth | Net income* |
| FY18 | 11,184 | 4% | 772 |
| FY19 | 10,390 | -7% | 2,012 |
| FY20 | 10,509 | 1% | 1,004 |
| FY21 | 10,681 | 2% | 1,314 |
| 1FQ22 | 3,115 | 35% | 526 |
| 2FQ22 | 3,116 | 19% | 501 |
| 3FQ22 | 2,802 | 3% | 346 |
| 4FQ22 | 2,628 | -13% | 276 |
| FY22 | 11,661 | 9% | 1,649 |
| 1FQ23 |
2,035 |
-35% |
29 |
| 2FQ23 | 1,887 | -49% | (33) |
| 3FQ23 (estim.) | 1,850-2,150 | -33% - -23% | NA |


 Subscribe to our free daily newsletter


