


 Micron: Fiscal 4Q22 Financial Results
Sales declined 23% Q/Q and 20% Y/Y, and even worst coming
This is a Press Release edited by StorageNewsletter.com on October 5, 2022 at 2:02 pm| (in $ million) | 4Q21 | 4Q22 | FY21 | FY22 |
| Revenue | 8,274 | 6,643 | 27,705 | 30,758 |
| Growth | -20% | 11% | ||
| Net income |
2,720 | 1,492 | 5,861 | 8,687 |
Micron Technology, Inc. announced results for its 4FQ22 and FY22, which ended September 1, 2022.
4FQ22 highlights:
• Revenue of $6.64 billion vs. $8.64 billion for 3FQ22 and $8.27 billion for 4FQ21
• GAAP net income of $1.49 billion, or $1.35 per diluted share
• Non-GAAP net income of $1.62 billion, or $1.45 per diluted share
• Operating cash flow of $3.78 billion vs. $3.84 billion for 3FQ22 and $3.88 billion for 4FQ21
FY22 highlights
• Revenue of $30.76 billion vs. $27.71 billion for the prior year
• GAAP net income of $8.69 billion, or $7.75 per diluted share
• Non-GAAP net income of $9.48 billion, or $8.35 per diluted share
• Operating cash flow of $15.18 billion vs. $12.47 billion for the prior year
“In FY22, Micron generated record revenue of $30.8 billion and delivered our 6th consecutive year of positive free cash flow, allowing us to return a record $2.9 billion to our shareholders,” said president and CEO Sanjay Mehrotra. “Our technology and manufacturing leadership in both DRAM and NAND, deep customer relationships, diverse product portfolio, and strong balance sheet put Micron on solid footing to navigate the weakened near-term supply-demand environment. We are taking decisive steps to reduce our supply growth including a nearly 50% wafer fab equipment capex cut vs. last year, and we expect to emerge from this downcycle well positioned to capitalize on the long-term demand for memory and storage.”
Investments in capital expenditures, net were $3.58 billion for 4FQ22 and $11.98 billion for FY22, which resulted in adjusted free cash flows of $196 million for the 4FQ22 and $3.21 billion for FY22. Micron repurchased approximately 13.2 million shares of its common stock for $784 million during 4FQ22 and 35.4 million shares of its common stock for $2.43 billion during the FY22 and ended the year with cash, marketable investments, and restricted cash of $11.06 billion, for a net cash position of $4.15 billion. On September 29, 2022, the board of directors declared a quarterly dividend of $0.115 per share, payable in cash on October 26, 2022, to shareholders of record as of the close of business on October 11, 2022.
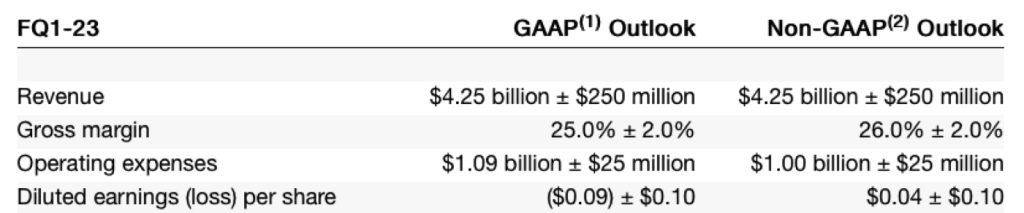
Business Outlook
The following table presents guidance for 1FQ23:
Comments
One of the top 2 WW storage company indicates that 4FQ22 revenue was $6.6 billion, down 23% Q/Q and 20% Y/Y. Expectation was much more: $7.2 billion ±$400 million.
FY22 revenue was a record at $30.8 billion, up 11% Y/Y.
Highlights for 4FQ22
- Financial results were impacted by rapidly weakening consumer demand and significant customer inventory adjustments across all end markets
- Responding decisively to this weak environment by decreasing supply growth through significant cuts to FY23 Capex and by reducing utilization in fabs
Highlights for FY22
- Record annual revenue in FY022 with solid profitability and free cash flow despite a challenging environment in the latter part of the year
- Ramped 1-alpha DRAM and 176-layer NAND nodes across portfolio; returned a record amount of cash to shareholders
- Achieved record revenue in mobile, auto, industrial, and networking end markets
- Share gains in client and data center SSDs contributed to record revenue in SSDs and also in consolidated NAND business
- Ramped new product categories like high-bandwidth HBM2e memory and GDDR6X
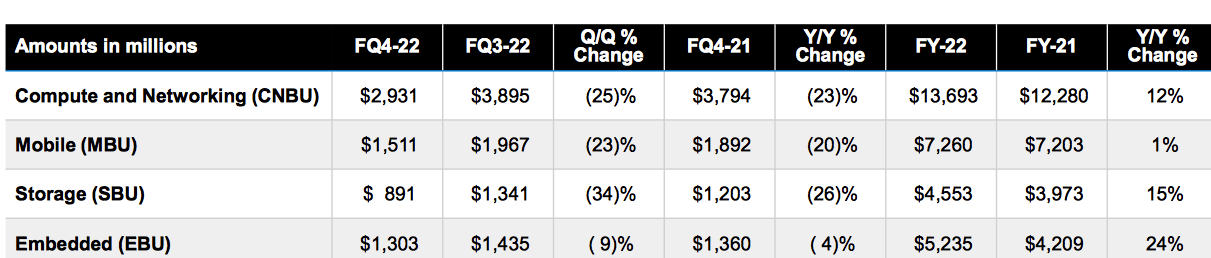
Revenue by business units
Revenue by technology
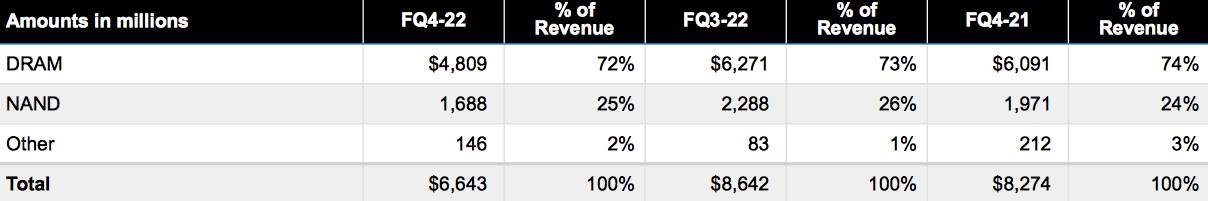
DRAM
4FQ22
- 72% of total revenue
- Revenue declined 23% Q/Q and down 21% Y/Y
- Bit shipments decreased by roughly 10% Q/Q
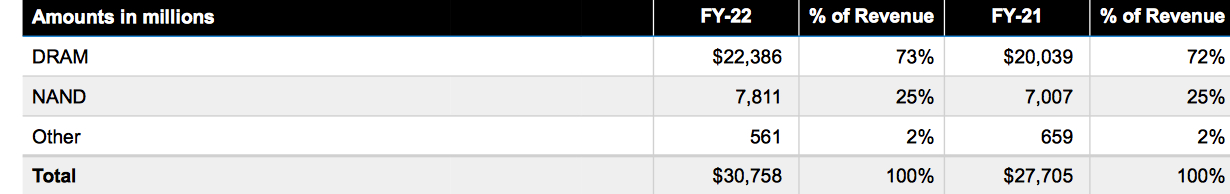
FY22
- ASPs declined low-teens percentage range Q/Q
- 73% of total revenue
- Revenue increased 12% Y/Y
NAND
4FQ22
- 25% of total revenue
- Revenue declined 26% Q/Q and down 14% Y/Y
- Bit shipments declined in the low-20s percentage range Q/Q
- ASPs declined in the mid-to-high-single-digit percentage range Q/Q
FY22
- 25% of total revenue
- Revenue up 11% Y/Y
4FQ22 financial results were impacted by rapidly weakening consumer demand and significant customer inventory adjustments across all end markets. The company is responding decisively to this weak environment by decreasing supply growth through significant cuts to fiscal 2023 Capex and by reducing utilization in its fabs. But the company is confident that the memory industry supply-demand balance will be restored, as a result of reduced industry supply growth combined with the long-term demand growth drivers for memory.
Very bad outlook for 1FQ23
Revenue is expected to be in the range of $4.0 billion and $4.5 billion or -40% to -32% Q/Q!
Industry outlook for Micron
CY22
- Industry bit demand growth for DRAM is now expected to be in the low percentage.
- An unprecedented confluence of macro events and customer inventory adjustments are depressing demand for DRAM and NAND to well below end consumption; extremely aggressive pricing environment.
- Expects supply growth to be significantly above the demand growth in CY22, contributing to very high supplier inventories for both DRAM and NAND.
- In 4FQ22, data center revenue was down both sequentially and year-over-year, driven primarily by declines in ASP. In FY22, the firm set a new revenue record for its cloud sales, which grew more than 30% Y/Y. Cloud end demand remains healthy, driven by secular growth in AI and the digital economy.
CY23 and beyond
- Expects demand growth to be closer to the long-term growth rate of both DRAM and NAND.
- Expects industry DRAM supply to grow well below demand growth. The firm is modeling a mid-single digit percentage growth in DRAM industry supply in 2023. NAND supply growth in CY23 is also expected to fall below demand growth.
- Expects long-term DRAM bit growth to be in the mid-teens percentage, slightly lower than prior expectation of mid-to-high teens due to a moderation in expectation of long-term PC unit sales trends.
- Continues to expect the NAND market, which benefits from elasticy, to grow around 28% over the long term.
NAND revenue only
| Period | Revenue in $ million |
Q/Q or Y/Y change for FY |
% of global revenue |
| FY19 | 5,335 | NA | 23% |
| 1FQ20 | 1,422 | 18% | 28% |
| 2FQ20 | 1,514 | 6% | 32% |
| 3FQ20 | 1,665 | 10% | 31% |
| 4FQ20 | 1,530 | -8% | 25% |
| FY20 | 6,131 | 14% | 29% |
| 1FQ21 | 1,574 | 3% | 27% |
| 2FQ21 | 1,650 | 5% | 26% |
| 3FQ21 | 1,812 | 10% | 24% |
| 4FQ21 | 1,971 | 9% | 21% |
| FY21 | 7,007 | 14% | 25% |
| 1FQ22 | 1,878 | -5% | 24% |
| 2FQ22 | ∼2,000 | 6% | 25% |
| 3FQ22 | 2,300 | 11% | 26% |
| 4FQ22 | 1,688 | -26% | 25% |
| FY22 | 7,811 | 11% | 25% |


 Subscribe to our free daily newsletter


