


 Micron: Fiscal 1Q22 Financial
NAND revenue at $1.9 billion, down 5% Q/Q and up 19% Y/Y
This is a Press Release edited by StorageNewsletter.com on December 22, 2021 at 2:03 pm| (in $ million) | 1Q21 | 1Q22 | Growth |
| Revenue |
5,773 | 7,687 | 33% |
| Net income (loss) | 806 | 2,306 |
Micron Technology, Inc. announced results for its first quarter of fiscal 2022, which ended Dec. 2, 2021.
1FQ22 highlights
• Revenue of $7.69 billion vs. $8.27 billion for 4FQ21 and $5.77 billion for 1FQ21
• GAAP net income of $2.31 billion, or $2.04 per diluted share
• Non-GAAP net income of $2.47 billion, or $2.16 per diluted share
• Operating cash flow of $3.94 billion vs. $3.88 billion for 4FQ21 and $1.97 billion for 1FQ21
“Micron delivered solid fiscal first quarter results led by strong product portfolio momentum,” said president and CEO Sanjay Mehrotra. “We are now shipping our industry-leading DRAM and NAND technologies across major end markets, and we delivered new solutions to data center, client, mobile, graphics and automotive customers. As powerful secular trends including 5G, AI, and EV adoption fuel demand growth, our technology leadership and world-class execution position us to create significant shareholder value in FY22 and beyond.”
Investments in capital expenditures, net were $3.27 billion for 1FQ22, which resulted in adjusted free cash flows of $671 million. The company repurchased approximately 3.6 million shares of its common stock for $259 million during the 1FQ22 and ended the quarter with cash, marketable investments, and restricted cash of $11.48 billion, for a net cash(2) position of $4.46 billion.
On December 17, 2021, the board of directors declared a quarterly dividend of $0.10 per share, payable in cash on January 18, 2022, to shareholders of record as of the close of business on January 3, 2022.
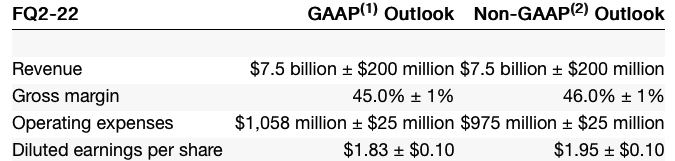
Business Outlook for 2FQ22
Comments
Global 1FQ22 revenue was $7.7 billion, down 7% Q/Q and up 33% Y/Y. Remember that outlook reported the former quarter was $7.65 billion ± $200 million
The sequential revenue decline was predominantly attributable to weakness related to non-memory component shortages at firm's customers.
75% of revenue comes from volume-based annual agreements, a significant increase from around 10% of revenue they represented 5 years ago.
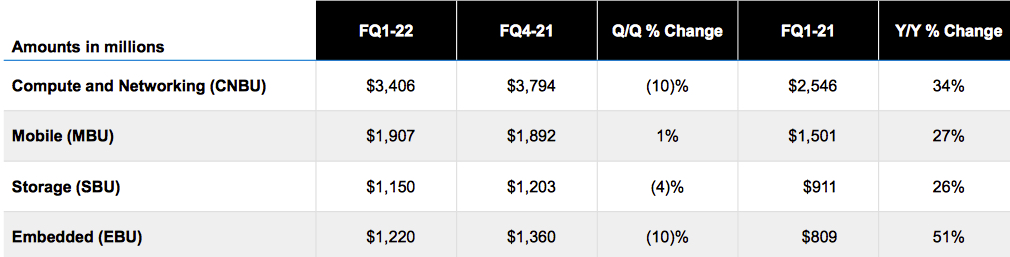
Revenue by business unit
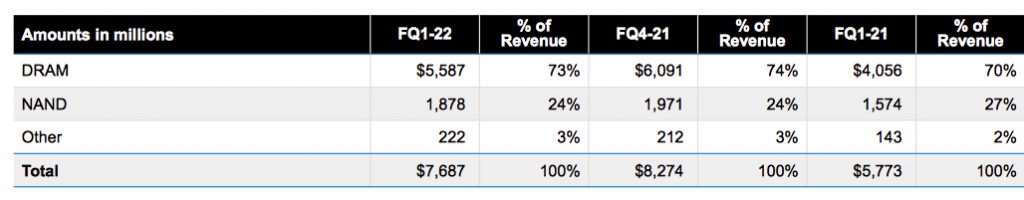
Revenue by technology
Revenue for the storage business unit was $1.2 billion, down 4% from 4FQ21 and up 26% Y/Y. Its profitability benefited in 1FQ22 from the progress made in ramping 176-layer node.
For NAND only
- 1FQ22 NAND revenue at $1.9 billion, representing 24% of global revenue, declining 5% Q/Q and up 19% Y/Y
- 176-layer NAND now accounting for the majority of NAND bit production
- Successfully transitioned to replacement gate
- Roadmap to scale for several gens while leveraging leadership in CMOS under array and QLC to maintain bit density leadership
- Bit shipments flat Q/Q
- ASPs down mid-single-digit percent range Q/Q
Micron outlook
- CY22 bit supply growth for DRAM and NAND expected to be in line with industry demand
- Planning to deliver record revenue with solid profitability in FY22 with stronger bit shipment growth in second half of the fiscal year
- Expect annual cost-per-bit reductions to be competitive with the industry in FY22 and over the long term
- Expect FY22 Capex in the range of $11 billion to $12 billion
- Revenue in 2FQ22 of $7.7 billion ± $200 million or a mere -2% to 3% Q/Q
Industry outlook
- Expect CY21 industry DRAM bit demand growth to be in the low 20% range and industry NAND bit demand growth to be in the high 30% range
- Expect CY22 industry bit demand growth to be in the mid-to-high teens for DRAM and approximately 30% for NAND
- Long term DRAM bit demand growth CAGR of mid-to-high teens percentage
- Long term NAND bit demand growth CAGR of approximately 30%
NAND revenue
| Period | Revenue in $ million | Q/Q or Y/Y change for FY | % of global revenue |
| FY19 | 5,335 | NA | 23% |
| 1FQ20 | 1,422 | 18% | 28% |
| 2FQ20 | 1,514 | 6% | 32% |
| 3FQ20 | 1,665 | 10% | 31% |
| 4FQ20 | 1,530 | -8% | 25% |
| FY20 | 6,131 | 14% | 29% |
| 1FQ21 | 1,574 | 3% | 27% |
| 2FQ21 | 1,650 | 5% | 26% |
| 3FQ21 | 1,812 | 10% | 24% |
| 4FQ21 | 1,971 | 9% | 21% |
| FY21 | 7,007 | 14% | 25% |
| 1FQ22 | 1,878 | -5% | 24% |


 Subscribe to our free daily newsletter


