


 Seagate: Fiscal 4Q22 Financial Results
Revenue down 13% Y/Y as HDD demand weakens
This is a Press Release edited by StorageNewsletter.com on July 22, 2022 at 2:02 pm| (in $ million) | 4Q21 | 4Q22 | FY21 | FY22 |
| Revenue | 3,013 | 2,628 | 10,681 | 11,661 |
| Growth | -13% | 9% | ||
| Net income (loss) | 482 | 276 | 1,314 | 1,649 |
4FQ22 highlights
- Revenue of $2.63 billion
- GAAP gross margin of 28.9%; non-GAAP gross margin of 29.3%
- GAAP diluted earnings per share (EPS) of $1.27; non-GAAP diluted EPS of $1.59
FY22 highlights
- Revenue of $11.66 billion
- GAAP gross margin of 29.7%; non-GAAP gross margin of 30.1%
- GAAP operating margin of 16.8%; non-GAAP operating margin of 18.4%
- GAAP diluted EPS of $7.36; non-GAAP diluted EPS of $8.18
- Cash flow from operations of $1.7 billion and free cash flow of $1.3 billion
- Returned $2.4 billion to shareholders through dividends and share repurchases
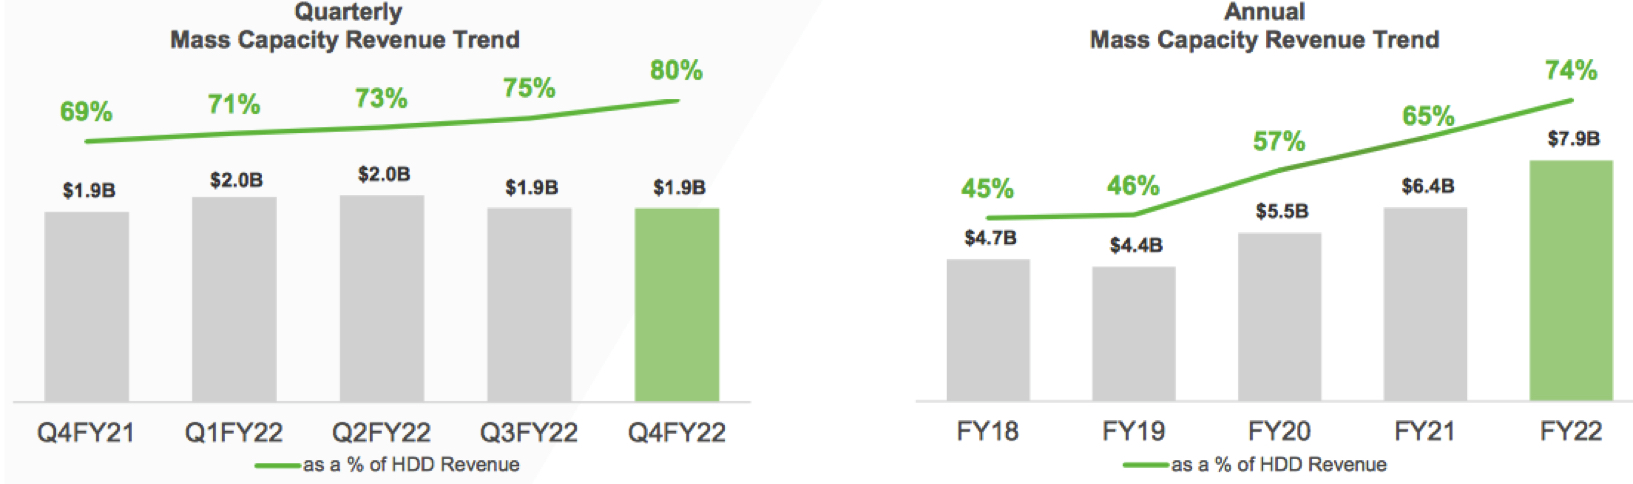
- Revenue from mass capacity storage markets increased 24% Y/Y and represented 74% of annual HDD revenue
Seagate Technology Holdings plc reported financial results for its fourth quarter and fiscal year ended July 1, 2022.
“Our June quarter results reflect stable mass capacity storage demand, offset by the impacts of Covid restrictive measures in Asia and weakening global economic conditions on our other end markets. These impacts were most pronounced in our consumer facing Legacy markets,” said Dave Mosley, CEO. “The confluence of macro-related challenges is continuing into the September quarter. In this environment, we are reducing our production plans to maintain supply discipline as our customers manage through macro uncertainty and on-going non-HDD component shortages, and we are diligently managing expenses to protect profitability. Looking further ahead, I remain confident that the multiple secular growth trends fueling demand for data and mass capacity storage solutions remain intact. Seagate is well positioned for macro recovery with a strong product roadmap, deep customer relationships and proven track record for disciplined execution.”
The company generated $180 million in cash flow from operations and $108 million in free cash flow during 4FQ22. For FY22, it generated $1.7 billion in cash flow from operations and $1.3 billion in free cash flow. During 4FQ22, it paid cash dividends of $152 million and repurchased 6 million ordinary shares for $486 million. For FY22, it paid cash dividends of $610 million and used $1.8 billion to repurchase 20 million ordinary shares, or 9% of the outstanding shares. Cash and cash equivalents totaled $615 million. There were 210 million ordinary shares issued and outstanding as of the end of FY22.
The board of directors declared a quarterly cash dividend of $0.70 per share, which will be payable on October 5, 2022 to shareholders of record as of the close of business on September 21, 2022. The payment of any future quarterly dividends will be at the discretion of the board and will be dependent upon financial position, results of operations, available cash, cash flow, capital requirements and other factors deemed relevant by the board.
Guidance for 1FQ23:
• Revenue of $2.5 billion, ±$150 million
• Non-GAAP diluted EPS of $1.40, ±$0.20
Comments
At the end of last quarter, sales of $2.8 billion ±$150 million were expected for 4FQ22 (or -5% to +5%). Finally, its 2.628 billion, down 13% Y/Y and 6% Q/Q.
For the former quarter, sales were much lower than expected, down 10% Q/Q and up 3% Y/Y.
Why sales decreased like that? The reason is clear: Seagate's WW HDD shipments in 2CQ22 drop to 44.30-46.50 million units, down 16.0% to 11.9% Q/Q and 31.0% to 34.2% Y/Y, according to the preliminaty results of of Trendfocus. And about all its revenue comes from HDDs, the firm being the leader in this category with about 44% of the WW market share in front of WD and Toshiba.
Nevertheless, it grew revenue by 9% Y/Y in FY22, fueled by 24% growth in mass capacity products. But mass capacity sales were flat Q/Q, due in part to strong cloud customer adoption of 20+TB nearline drives.
On June quarter, financial results reflected near record of data center demand, contrasted with the impacts from a confluence of macro headwinds in other ends markets, particularly in the consumer-facing legacy markets. The company believe the secular data trends driving long-term demand growth for mass capacity storage and infrastructure remain intact.
However, the impacts from Covid lockdowns in Asia, non-HDD component shortages and global inflationary pressures intensified late in the quarter.
In the June quarter, total HDD drive capacity shipments increased slightly to 155EB, of which the mass capacity market made up 90% of the total, with shipments of 139EB and 4% Q/Q and 12% Y/Y.
Nearline products contributed 119EB, up 1% Q/Q and 17% Y/Y, driven by strong US cloud customer demand for 20+TB product family. With richer mix of high capacity nearline drives supported a record total HDD capacity per drive of 7.8TB compared with 5.4TB one year ago.
On a revenue basis, mass capacity represented 80% of total HDD revenue at $1.9 billion in 3FQ22, less compared to the prior quarter and slightly higher than the prior year period.
Within the legacy market, revenue was $489 million, down 24% Q/Q and 43% Y/Y. The decline was most pronounced in the client PC end markets, which now represent a mid-single-digit percentage of overall revenue. Within this market, demand rapidly deteriorated at the end of the quarter, as lockdowns and surging inflation severely impacted consumer spending for PCs and external drives. Exiting the June quarter, the legacy business represented only 20% of HDD revenue, a historic low.
Consumer demand also deteriorated more than anticipated, reflecting the sharp rise in inflation impacting consumer discretionary spending.
Revenue for non-HDD business was $219 million, down about 8% Q/Q and 21% Y/Y. Component availability remains a challenge and impacted the SSD business during 4FQ22, leaving the company unable to fulfill all the customer demand.
US cloud data center demand remained strong. However, persistent non-HDD component shortages have led to inventory imbalances, precluding new data center build-outs from being completed. These, along with other supply disruptions have led to a buildup in inventory levels across a broad spectrum of customers, a trend that continued through the end of the quarter.
As macro uncertainties and inflationary pressures intensify, Seagate expects customers will increasingly focus on reducing their inventory levels, while maintaining the ability to address end market demand.
In response to the current business conditions, the manufacturer is taking actions to maintain strong supply discipline and a favorable pricing environment. It is reducing its manufacturing and production plans, while continuing to focus on driving efficiencies in the factory and across supply chains.
The vendor is executing its development plans for the 30+TB product family based on HAMR technology, which enables capacity points of 30, 40, 50TB and beyond to support future data demand growth.
As the firm enter FY23, it expects macro uncertainties and non-HDD component shortages to continue pressuring its end market over the near term and then revenue will reaach in 1FQ23 $2.5 billion ±$150 million or 1% to -11%. It is taking action to manage its cash and safeguard profitability, including managing its supply to restore healthy customer inventory levels.
HDDs from 1FQ16 to 4FQ22
| Fiscal period | HDD ASP | Exabytes shipped |
Average GB/drive |
| 1Q16 | $58 | 55.6 | 1,176 |
| 2Q16 | $59 | 60.6 | 1,320 |
| 3Q16 | $60 | 55.6 | 1,417 |
| 4Q16 | $67 | 61.7 | 1,674 |
| 1Q17 | $67 | 66.7 | 1,716 |
| 2Q17 | $66 | 68.2 | 1,709 |
| 3Q17 | $67 | 65.5 | 1,800 |
| 4Q17 | $64 | 62.2 | 1,800 |
| 1Q18 | $64 | 70.3 | 1,900 |
| 2Q18 | $68 | 87.5 | 2,200 |
| 3Q18 | $70.5 | 87.4 | 2,400 |
| 4Q18 |
$72 | 92.9 | 2,500 |
| 1Q19 | $70 | 98.8 | 2,500 |
| 2Q19 |
$68 | 87.4 | 2,400 |
| 3Q19 |
$72 | 76.7 | 2,400 |
| 4Q19 | $79.7 | 84.5 | 2,700 |
| 1Q20 |
$81 | 98.3 | 2,900 |
| 2Q20 |
$77 | 106.9 | 3,300 |
| 3F20 | $86 | 120.2 | 4,100 |
| 4F20 |
$89 | 117.0 | 4,500 |
| 1F21 |
$82 | 114.0 | 4,400 |
| 2F21 |
$81 | 129.2 | 4,300 |
| 3F21 | $91 | 139.6 | 5,100 |
| 4F21 | $97 | 152.3 | 5,400 |
| 1F22 |
$103 | 159.1 | 5,700 |
| 2F22 |
$106 | 163.2 | 6,100 |
| 3F22 |
NA | 154.2 | 6,700 |
| 4F22 |
NA | 154.6 |
7,800 |
FY ending in June
* in $million
| Period | Revenue* | Y/Y growth | Net income* |
| FY18 | 11,184 | 4% | 772 |
| FY19 | 10,39 | -7% | 2,012 |
| FY20 | 10,509 | 1% | 1,004 |
| FY21 | 10,681 | 2% | 1,314 |
| 1FQ22 | 3,115 | 35% | 526 |
| 2FQ22 | 3,116 | 19% | 501 |
| 3FQ22 | 2,802 | 3% | 346 |
| 4FQ22 | 2,628 | -13% | 276 |
| FY22 | 11,661 | 9% | 1,649 |


 Subscribe to our free daily newsletter


