


 Box: Fiscal 1Q22 Financial Results
Sales up 10% Y/Y and 2% Q/Q, lower losses
This is a Press Release edited by StorageNewsletter.com on June 3, 2021 at 2:32 pm| (in $ million) | 1Q21 | 1Q22 | Growth |
| Revenue |
183.6 | 202.4 | 10% |
| Net income (loss) | (25.6) | (14.6) |
Box, Inc. announced financial results for the first quarter of fiscal year 2022, which ended April 30, 2021.
“Our vision for the Content Cloud is resonating with our customers. They recognize the strategic importance of securing, automating, integrating, and collaborating on content, and are investing in the full power of Box,” said Aaron Levie, co-founder and CEO. “The strategy we’ve been executing on is yielding positive results as reflected in our strong start to FY22 and we’re poised to build on our leadership and drive our next phase of growth.”
“Q1 was an excellent start to the year, highlighted by strong billings, RPO, and revenue growth, in addition to increased profitability,” said Dylan Smith, Box’s co-founder. “As we build on this momentum and continue to focus on driving profitable growth, we’re well positioned to accelerate revenue growth over time and achieve our long-term financial targets.”
1FQ22 Financial Highlights
• Revenue was $202.4 million, an increase of 10% from 1FQ21.
• Remaining performance obligations were $864.8 million, an increase of 20% from 1FQ21.
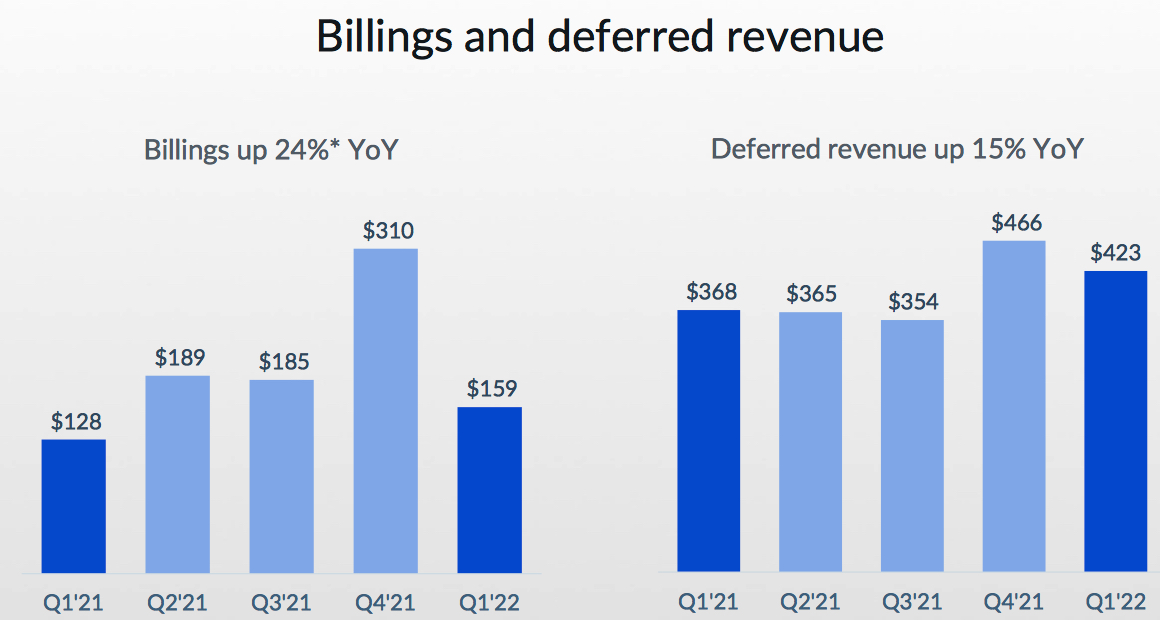
• Deferred revenue was $423.2 million, an increase of 15% from 1FQ21.
• Billings were $159.4 million, an increase of 24% from 1FQ21.
• GAAP gross profit was $141.5 million, or 70% of revenue. This compares to a GAAP gross profit of $129.6 million, or 71% of revenue, in 1FQ21.
• Non-GAAP gross profit was $147.9 million, or 73% of revenue. This compares to a non-GAAP gross profit of $134.1 million, or 73% of revenue, in 1FQ21.
• GAAP operating loss was $10.3 million, or 5% of revenue. This compares to a GAAP operating loss of $24.2 million, or 13% of revenue, in 1FQ21.
• Non-GAAP operating income was $34.4 million, or 17% of revenue. This compares to a non-GAAP operating income of $17.2 million, or 9% of revenue, in 1FQ21.
• GAAP net loss per share, basic and diluted was $0.09 on 161.7 million weighted-average shares outstanding. This compares to a GAAP net loss per share of $0.17 in 1FQ21 on 151.9 million weighted-average shares outstanding.
• Non-GAAP net income per share, diluted was $0.18. This compares to a non-GAAP net income per share of $0.10 in 1FQ21.
• Net cash provided by operating activities was $94.8 million, an increase of 53% from net cash provided by operating activities of $61.9 million in 1FQ21.
• Free cash flow was positive $75.9 million. This compares to free cash flow of positive $39.9 million in 1FQ21.
2FQ22 Guidance
Revenue is expected to be in the range of $211 million to $212 million. GAAP operating margin is expected to be in the range of negative 5% to negative 4.5%, and non-GAAP operating margin is expected to be in the range of 18% to 18.5%. GAAP basic and diluted net loss per share are expected to be in the range of $0.13 to $0.12. Non-GAAP diluted net income per share is expected to be in the range of $0.17 to $0.18. Weighted-average basic and diluted shares outstanding are expected to be approximately 160 million and 167 million, respectively.
FY22 Guidance
Revenue is expected to be in the range of $845 million to $853 million. GAAP operating margin is expected to be negative 4%, and non-GAAP operating margin is expected to be in the range of 18% to 18.5%. GAAP basic and diluted net loss per share are expected to be in the range of $0.50 to $0.45. Non-GAAP diluted net income per share is expected to be in the range of $0.71 to $0.76. Weighted-average basic and diluted shares outstanding are expected to be approximately 154 million and 161 million, respectively.
Comments
Box records a little better than expected revenue, expected last quarter to be $200-201 million, and finally $202 million, up 10% Y/Y and 2% Q/Q.
As we remarked 3 months ago, it never stops to grow in all fiscal year since 2011 but more and more modestly as the company is expanding, which is usual.
The only quarter of profitability was 1FQ21 with tiny $2.6 million and the company is back to losses since the last 4 quarters. Since 2011, Box didn't record any fiscal year of profitability.
60% of last quarter's revenue is attributable to customers who have purchased at least one additional product up from 54% a year ago. In 1FQ22, the company closed 59 deals worth more than $100,000, a figure up 48% Y/Y. 49% of these 6-figure deals included one of firm's multi product suite offerings, a new record, and up from 28% a year ago.
1FQ22 billings of $159 million were up 24% Y/Y.
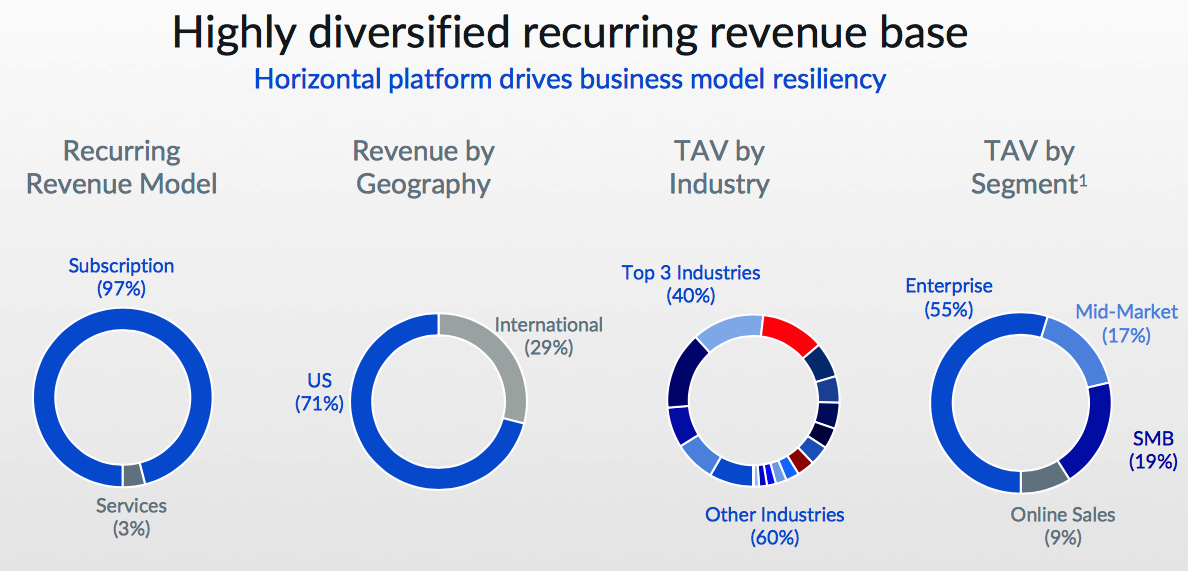
Note: Figures as of quarter ended January 31, 2021.
(1) Enterprise, mid-market, and SMB represent companies with account coverage and have 2,000+, 500-1,999, <500 employees, respectively. Online sales represents companies that do not have an assigned account executive
Note: $ values are shown in millions
*Reconciliations of billings to revenue, deferred revenue, and contract assets calculated in accordance with GAAP
Box is committed to FY24 targets of delivering a growth rate of 12% to 16% in operating margin in the range of 23% to 27%.
FY revenue and losses in $ million
| Period | Revenue | Y/Y growth | Net income (loss) |
| FY11 | 21.1 | NA | (53.3) |
| FY12 | NA | NA | NA |
| FY13 | 58.8 | NA | (112.6) |
| FY14 | 124.2 | 112% | (168.6) |
| FY15 | 216.4 | 74% | (168.2) |
| FY16 | 302.7 | 40% | (202.9) |
| FY17 | 398.6 | 32% | (150.8) |
| FY18 | 506.1 | 27% | (155.0) |
| FY19 | 608.4 | 20% | (134.6) |
| FY20 | 696.2 | 14% | (144.3) |
| 1FQ21 |
183.6 | 13% | 2.6 |
| 2FQ21 | 192.3 | 11% | (7.7) |
| 3FQ21 | 196.0 | 11% | (5.3) |
| 4FQ21 | 198.9 | 8% | (4.9) |
| FY21 |
770.8 | 11% | (43.4) |
| 1FQ22 |
202.4 |
2% |
(14.6) |
| 2FQ22* |
211-212 | 4-5% | NA |
| FY22* |
845-853 |
10%-11% |
NA |
* Estimations
Note: IPO in 2015 raising $175 million


 Subscribe to our free daily newsletter


