


Quantum: Fiscal 1Q21 Financial Results
Catastrophic period due to Covid-19
This is a Press Release edited by StorageNewsletter.com on August 10, 2020 at 2:18 pm| (in $ million) | 1Q20 | 1Q21 | Growth |
| Revenue |
105.6 | 73.3 | -31% |
| Net income (loss) | (3.8) | (10.7) |
Quantum Corporation announced financial results for its fiscal first quarter ended June 30, 2020.
1FQ21 Financial Summary
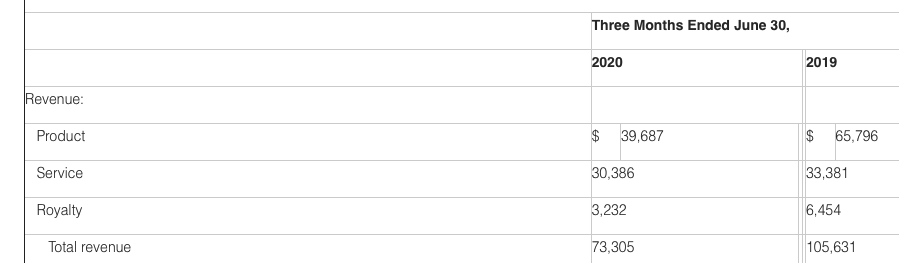
- Revenue was $73.3 million
- Gross margin was 42.1%
- Total operating expenses decreased $8.7 million, or 20%, compared to 4FQ20
- GAAP Net loss of $10.7 million, or $(0.27) per diluted share
- Adjusted Net Loss of $6.8 million or $(0.17) per diluted share
- Adjusted EBITDA of $1.4 million
Jamie Lerner, chairman and CEO, commented: “The Quantum team executed with agility and resiliency in 1FQ21, advancing our long-term transformation strategy amidst a dynamic and challenging environment. Our quarterly financial results were in-line with expectations, and while we recognize many of our customers are still facing uncertainty and volatility, we have seen some encouraging trends already in the second quarter supporting our belief that 1FQ21 was the trough in our business. Now, as many industries begin to resume operations, our solutions are increasingly in demand. We already have clear visibility to revenue targets in 2FQ21 representing a double-digit percentagage increase sequentially as compared to 1FQ21.”
He continued: “Our second fiscal quarter is typically strong from a seasonal perspective. Sports and entertainment customers are ramping backup albeit with shortened seasons, and our business with these customers does not require spectators, just the resumption of operations and the capture of video data for streaming and other uses. We have continued to innovate our technology and serve our customers’ growing video and unstructured data needs all while controlling costs and strengthening our balance sheet. Combined with the improvements we have made to the company over the past 24 months, I am confident that the re-built earnings power of Quantum will become increasingly apparent as we navigate through this crisis and expand our leadership in managing and retaining unstructured data.“
1FQ21 vs. 4FQ20
Revenue was $73.3 million, down 31% compared to $105.6 million in the year ago quarter and in-line with guidance.
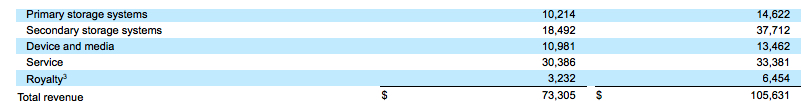
Revenue declined across the company’s product lines largely due to Covid-19. The revenue decline was led by a decrease in product revenue due to reduced demand for secondary storage systems and lower hyperscale revenue, as well as a decrease in royalty revenue due to overall declines in market unit volumes as the primary use of tape continues to transition from backup to archive workflows.
Revenue in 1FQ20 includes incremental contribution from the acquisition of the ActiveScale object storage business, which closed on March 17, 2020.
Gross profit in 1FQ21 was $30.9 million, or 42.1% gross margin, compared to $45.8 million, or 43.4% gross margin, in the year ago quarter. Gross margins contracted modestly Y/Yr primarily due to spreading fixed overhead costs over lower revenue combined with lower high margin royalty revenues.
Total operating expenses in 1FQ21 were $34.3 million, or 46.9% of revenue, compared to $43.1 million, or 40.8% of revenue, in 1FQ20.
Selling, general and administrative expenses declined 33% to $23.1 million for 1FQ21 compared to $34.4 million in 1FQ20.
R&D expenses were $10.2 million in 1FQ21, up 21% compared to $8.4 million in 1FQ20.
Net loss in 1FQ21 was $10.7 million, or ($0.27) per basic and diluted share, compared to a Net loss of $3.8 million, or ($0.11) per basic and diluted share, in 1FQ20.
Excluding stock compensation, restructuring charges and non-recurring charges, Adjusted Net Loss in 1FQ21 was $6.8 million, or ($0.17) per diluted share, compared to Adjusted Net Income of $5.4 million, or $0.13 per diluted share, in 1FQ20.
Adjusted EBITDA in 1FQ21 decreased $11.7 million to $1.4 million, compared to $13.1 million in 1FQ20.
Balance Sheet and Liquidity
- Cash and cash equivalents of $29.1 million as of June 30, 2020, compared to $12.2 million as of March 31, 2020. Both balances include $5.0 million in restricted cash required under the company’s credit agreements, and $0.8 million of short-term restricted cash.
- Outstanding debt as of June 30,2020 on a gross basis was $195.2 million and on a net basis was $170.6 million after netting $24.6 million in unamortized debt issuance costs. This compares to $167.8 million of outstanding debt as of March 31, 2020 on a gross basis, and on a net basis was $154.1 million after netting $13.7 million in unamortized debt issuance costs. The increase in long-term debt from March 31, 2020 was primarily due to term debt borrowings of $20.0 million and a $10.0 million Paycheck Protection Program Term Loan.
- Total interest expense was $6.4 million for the three months ended June 30, 2020.
On June 16, 2020 the company agreed to amend its revolving and term loan credit facilities, securing an additional $20 million in incremental liquidity and negotiating more flexible loan terms and conditions. The facilities expire on December 27, 2023. Among other terms, the amended credit facilities provide a holiday period for certain financial covenants through June 30, 2021 and the term loan credit facility contains a more favorable equity claw back feature. The terms of the 2020 term loan credit agreement are substantially similar to the terms of the existing term loan, including in relation to maturity, security and pricing.
Outlook
For 2FQ21, the company expects revenues of $83 million plus or min $2 million.
The company expects adjusted net loss to be $3 million plus or min $0.5 million and related adjusted net loss per share of $(0.08) plus or min $0.01. Adjusted EBITDA is expected to be $5 million plus or min $1 million.
Comments
Quantum was waiting for this catastrophic quarter, announcing at the end of former 3-month period expected revenue for next one of $73 million plus or min $1 million.
It's about exactly was it did, $73.3 million, down 31% Y/Y and 17% Q/Q.
The worst decreases happen to royalties and secondary storage systems revenues, approximately divided yearly by two.
Next quarter is expected to be a little better with sales up 11% to 16% Q/Q.
Fiscal year ended March 31
| (in $ million) | Revenue | Y/Y Growth | Net income (loss) |
| 1998 | 1,189.8 | NA |
170.8 |
| 1999 | 1,302.7 | 9% | (29.5) |
| 2000 | 1,418.9 | 9% | 40.8 |
| 2001 | 1,405.8 | -1% | 160.7 |
| 2002 | 1,087.8 | -23% | 42.5 |
| 2003 | 870.8 | -20% | (264.3) |
| 2004 | 808.3 | -7% | (62.0) |
| 2005 | 794.2 | -2% | (3.5) |
| 2006 | 834.3 | +5% | (41.5) |
| 2007 | 1,016.2 | +22% | (64.1) |
| 2008 | 975.7 | -4% | (60.2) |
| 2009 | 809.0 | -17% | (356.1) |
| 2010 | 681.4 | -16% | 16.6 |
| 2011 | 672.3 | -1% | 4.5 |
| 2012 | 652.4 | -3% | (8.8) |
| 2013 | 587.6 | -10% | (52.4) |
| 2014 | 553.2 | -6% | (21.5) |
| 2015* | 543.7 | -2% | 15.4 |
| 2016* | 479.8 | -12% | (75.6) |
| 2017* | 493.1 | 3% | (2.4) |
| 2018 |
437.7 |
-11% | (43.3) |
| 2019 |
402.7 |
-8% | (42.8) |
| 1FQ20 |
105.6 |
-2% | (3.8) |
| 2FQ20 |
105.8 |
18% | (2.3) |
| 3FQ20 |
103.3 | 1% | 4.7 |
|
4FQ20 |
88.2 |
-15% | (3.8) |
| 2020 |
402.9 |
0% | (5.2) |
| 1FQ21 |
73.3 |
-31% | (10.7) |
* figures as restated


 Subscribe to our free daily newsletter


