


 FalconStor: Fiscal 2Q21 Financial Results
Sales down 7% at $3.3 million with loss
This is a Press Release edited by StorageNewsletter.com on August 6, 2021 at 2:03 pm| (in $ million) | 2Q20 | 2Q21 | 6 mo. 20 | 6 mo. 21 |
| Revenue | 3.5 | 3.3 | 6.7 | 7.1 |
| Growth | -7% | 6% | ||
| Net income (loss) | 0.4 | (0.3) | (0.3) | 0.1 |
FalconStor Software, Inc. announced financial results for its second quarter and first half of fiscal year 2021, which ended on June 30, 2021.
“We continue to make good progress vs. our strategic plans to reinvent FalconStor, enhance the value we deliver to our customers, and innovate within the cloud-based data protection market,” said Todd Brooks, CEO. “While we were disappointed that our second quarter total revenue declined Y/Y by 6.9%, total revenue for 1FH21 increased Y/Y by 6.1%. Over the next year, we expect our Y/Y quarterly revenue growth to continue to stabilize as our sales pipeline becomes more predictable, and we expand our markets.”
“Migration to the cloud, data center rationalization and infrastructure optimization are top priorities for enterprise CIOs in the post-pandemic world, and FalconStor plays a vital role in each,” he added. “Our market, strategic focus, and results over the last 3 years allowed us to successfully raise $4 million in new growth equity since the beginning of the 2FQ21. We are excited by the trust our shareholders have placed in our team to deliver customer and shareholder value.”
2FQ21 Financial Results
• Product Revenue: 2% product revenue decline to $1,602,005, compared to $1,632,055 in 2FQ20
• New Customer Billings: $1,938,863, compared to $1,915,199 in 2FQ20
• Total Revenue: $3.3 million, compared to $3.5 million in 2FQ20
• Total Cost of Revenue: $0.4 million, compared to $0.4 million in 2FQ20
• Total Operating Expenses: $3.0 million, compared to $2.6 million in 2FQ20
• GAAP Net Income (Loss): $(0.3) million, compared to $0.4 million in 2FQ20
• Ending Cash: $3.7 million, compared to $1.5 million in 2FQ20
1FH21 Financial Results
• Product Revenue: 40% product revenue increase to $3.7 million, compared to $2.7 million in 1FH20
• New Customer Billings: $1,500,540, compared to $1,469,815 in 1FH20
• Total Revenue: $7.1 million, compared to $6.7 million in 1FH20
• Total Cost of Revenue: $1.1 million, compared to $0.9 million in 1FH20
• Total Operating Expenses: $6.2 million, compared to $5.6 million in 1FH20
• GAAP Net Income (Loss): $0.1 million, compared to $(0.3) million in 1FH20
• Ending Cash: $3.7 million, compared to $1.5 million in 1FH20
2QFQ1 Business Highlights
• Delivered updates to our next-gen long-term data retention and recovery technology in StorSafe, built with a bridge to all industry-leading public clouds for long-term archival optimization, including AWS, Microsoft Azure, IBM Cloud, and Wasabi
• Continued our win trajectory in IBM environments, specifically IBM I and AS/400 system implementations
• Continued to deliver value to our MSP business partners, with partner BlueChip growing to 300 customers and 4PB of data under management.
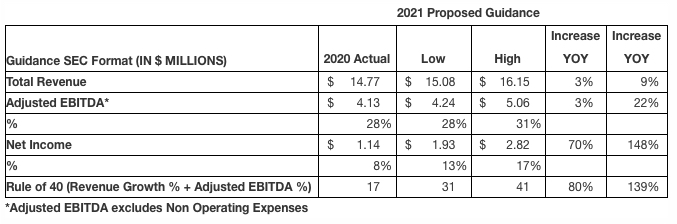
2021 guidance previously provided
Comments
In FY09, the company has an average quarterly revenue of $22.4 million. Here it's a mere $3.3 million.
For 2FQ21 and 2FQ20, product revenue represented 49% and 47% of total revenue, respectively. Product revenue of $1,602,005 for 2FQ21 decreased $30,050, or 2%, from $1,632,055 in 2FQ20.
Maintenance and technical support services revenue for 2FQ21 decreased to $1.6 million, compared to $1.9 million in 2FQ20.
Professional services revenue for 2FQ21 increased to $56,486, compared to $2,622 in 2FQ20.
Selling and marketing expenses increased $0.2 million, or 24%, to $1.3 million for 2FQ21 from $1.0 million in 2FQ20. The increase was primarily related to promotional campaign expenses and an increase in personnel related costs resulting from firm's reinstatement of workforce that was reduced as part of the 2020
Total cash and cash equivalents increased $1.8 million to $3.7 million at June 30, 2021 compared to December 31, 2020.
For the three and six months ended June 30, 2021, the company had 2 and 3 customers that accounted for 10% or more of total revenue, respectively.
No guidance for next quarter and earnings call transcript were published.
| FY | Revenue in $ million |
Growth |
| 2004 | 28.7 | NA |
| 2005 | 41.0 | 43% |
| 2006 | 55.1 | 34% |
| 2007 | 77.4 | 41% |
| 2008 | 87.0 | 12% |
| 2009 | 89.5 | 3% |
| 2010 | 82.8 | -7% |
| 2011 | 82.9 | 0% |
| 2012 | 75.4 | -9% |
| 2013 | 58.6 | -32% |
| 2014 | 46.3 | -21% |
| 2015 | 48.6 | 5% |
| 2016 | 30.3 | -38% |
| 2017 | 25.2 | -17% |
| 2018 | 17.8 | -29% |
| 2019 | 16.5 | -7% |
| 2020 | 14.8 | -10% |
| 1FQ21 | 3.8 | 20% |
| 2FQ21 |
3.3 |
-7% |


 Subscribe to our free daily newsletter


