









Only 3 Among 177,935 HDDs Never Failed in 2Q21
6TB Seagate (ST6000DX000), 12TB HGST (HUH721212ALE600), 16TB Western Digital (WUH721816ALE6L0)
This is a Press Release edited by StorageNewsletter.com on August 10, 2021 at 1:32 pm This report, published on October 20, 2020, was written on the blog of Backblaze, Inc. by Andy Klein, principal storage cloud evangelist.
Backblaze Drive Stats for 2Q21
As of June 30, 2021, Backblaze had 181,464 drives spread across 4 data centers on 2 continents.
Of that number, there were 3,298 boot drives and 178,166 data drives. The boot drives consisted of 1,607 HDDs and 1,691 SSDs. This report will review the quarterly and lifetime failure rates for the data drives, and we’ll compare the failure rates of our HDD and SSD boot drives. Along the way, we’ll share our observations of and insights into the data presented.
2Q21 HDD Failure Rates
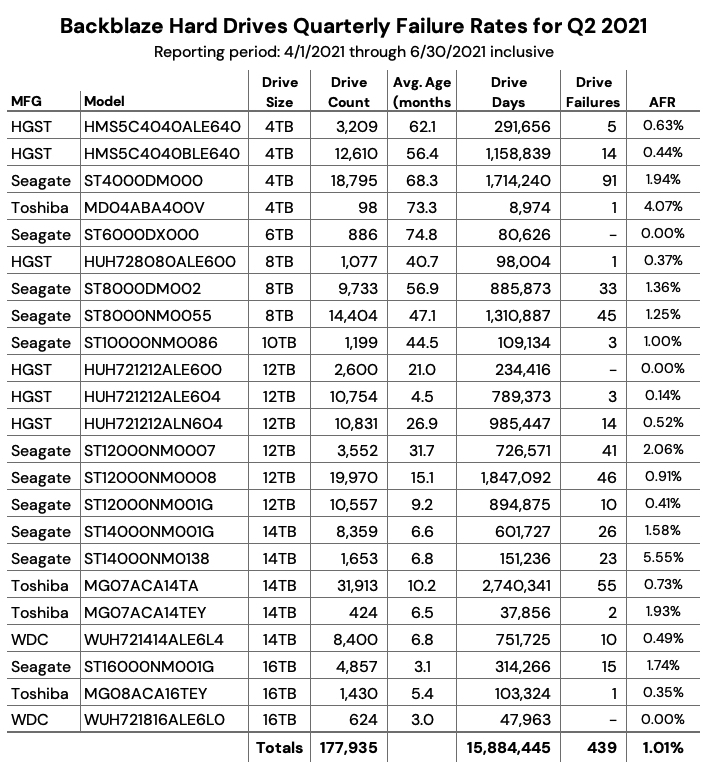
At the end of June 2021, the cloud storage company was monitoring 178,166 HDDs used to store data. For this evaluation, we removed from consideration 231 drives which were used for either testing purposes or as drive models for which we did not have at least 60 drives. This leaves us with 177,935 HDDs for the 2Q21 quarterly report, as shown below.
Notes and Observations on 2Q21 Stats
The data for all of the drives in our data centers, including the 231 drives not included in the list above, is available for download on the HDD Test Data webpage.
Zero Failures
Three drive models recorded zero failures during 2Q21, let’s take a look at each.
• 6TB Seagate (ST6000DX000): The average age of these drives is over 6 years (74 months) and with 1 failure over the last year, this drive is aging quite well. The low number of drives (886) and drive days (80,626) means there is some variability in the failure rate, but the lifetime failure rate of 0.92% is solid.
• 12TB HGST (HUH721212ALE600): These drives reside in our Dell storage servers in our Amsterdam data center. After recording a quarterly high of 5 failures last quarter, they are back on track with zero failures this quarter and a lifetime failure rate of 0.41%.
• 16TB Western Digital (WUH721816ALE6L0): These drives have only been installed for 3 months, but no failures in 624 drives is a great start.
Honorable Mention
Three drive models recorded 1 drive failure during the quarter. They vary widely in age.
• On the young side, with an average age of 5 months, the 16TB Toshiba (MG08ACA16TEY) had its first drive failure out of 1,430 drives installed.
• At the other end of the age spectrum, one of our 4TB Toshiba (MD04ABA400V) drives finally failed, the first failure since 4Q18.
• In the middle of the age spectrum with an average of 40.7 months, the 8TB HGST drives (HUH728080ALE600) also had just 1 failure this past quarter.
Outliers
Two drive models had an annualized failure rate (AFR) above 4%, let’s take a closer look.
• The 4TB Toshiba (MD04ABA400V) had an AFR of 4.07% for 2Q21, but as noted above, that was with 1 drive failure. Drive models with low drive days in a given period are subject to wide swings in the AFR. In this case, one less failure during the quarter would result in an AFR of 0% and one more failure would result in an AFR of over 8.1%.
• The 14TB Seagate (ST14000NM0138) drives have an AFR of 5.55% for Q2 2021. These Seagate drives along with 14TB Toshiba drives (MG07ACA14TEY) were installed in Dell storage servers deployed in our US West region about six months ago. We are actively working with Dell to determine the root cause of this elevated failure rate and expect to follow up on this topic in the next quarterly drive stats report.
Overall AFR
The quarterly AFR for all the drives jumped up to 1.01% from 0.85% in 1Q21 and 0.81% in 2Q20. This jump ended a downward trend over the past year. The increase is within our confidence interval, but bears watching going forward.
HDDs vs. SSDs, a Follow-up
In our 1Q21 report, we took an initial look at comparing our HDD and SSD boot drives, both for 1Q and lifetime timeframes. As we stated at the time, a numbers-to-numbers comparison was suspect as each type of drive was at a different point in its life cycle. The average age of the HDD drives was 49.63 months while the SSDs average age was 12.66 months. As a reminder, the HDD and SSD boot drives perform the same functions which include booting the storage servers and performing reads, writes, and deletes of daily log files and other temporary files.
To create a more accurate comparison, we took the HDD boot drives that were in use at the end of 4Q20 and went back in time to see where their average age and cumulative drive days would be similar to those same attributes for the SDDs at the end of 4Q20. We found that at the end of 4Q15 the attributes were the closest.
Let’s start with the HDD boot drives that were active at the end of 4Q20.
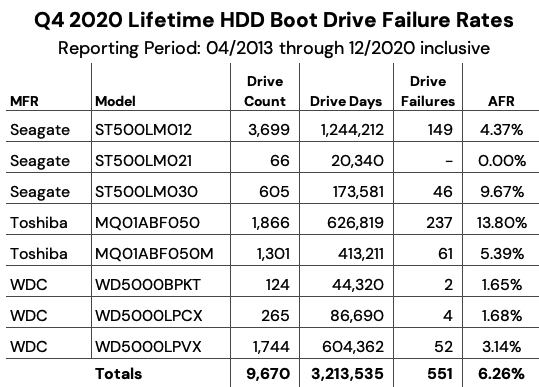
Next, we’ll look at the SSD boot drives that were active at the end of 4Q20.
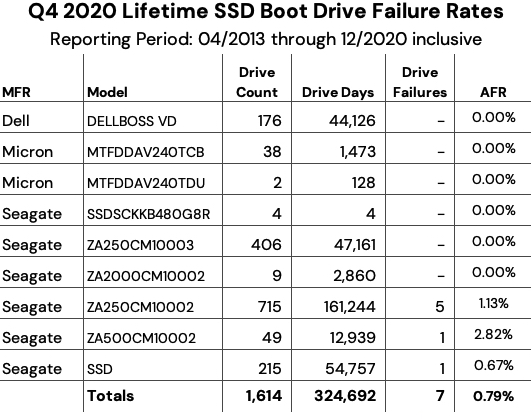
Finally, let’s look at the lifetime attributes of the HDDs active in 4Q20 as they were back in 4Q15.
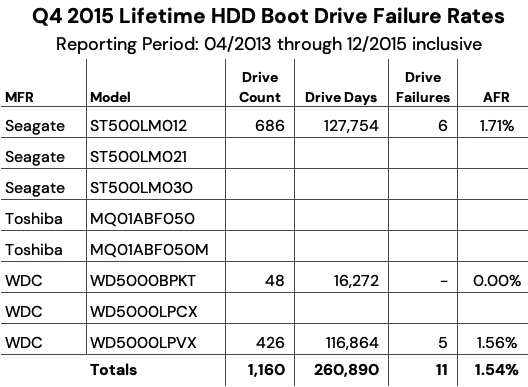
To summarize, when we control using the same drive models, the same average drive age, and a similar number of drive days, HDD and SSD drives failure rates compare as follows:
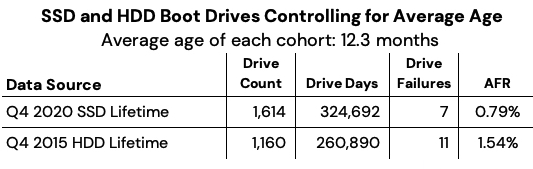
While the failure rate for the HDD boot drives is nearly 2x higher than the SSD boot drives, it is not the nearly 10x failure rate we saw in the 1Q21 report when we compared the 2 types of drives at different points in their lifecycle.
Predicting the Future?
What happened to the HDD boot drives from 2016 to 2020 as their lifetime AFR rose from 1.54% in 4Q15 to 6.26% in 4Q20? The chart below shows the lifetime AFR for the HDD boot drives from 2014 through 2020.
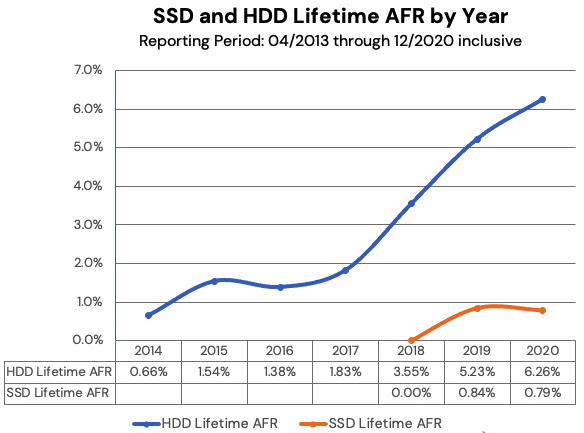
As the graph shows, beginning in 2018 the HDD boot drive failures accelerated. This continued in 2019 and 2020 even as the number of HDD boot drives started to decrease when failed HDD boot drives were replaced with SSD boot drives. As the average age of the HDD boot drive fleet increased, so did the failure rate. This makes sense and is borne out by the data.
This raises a couple of questions:
• Will the SSD drives begin failing at higher rates as they get older?
• How will the SSD failure rates going forward compare to what we have observed with the HDD boot drives?
We’ll continue to track and report on SSDs vs. HDDs based on our data.
Lifetime HDD Stats
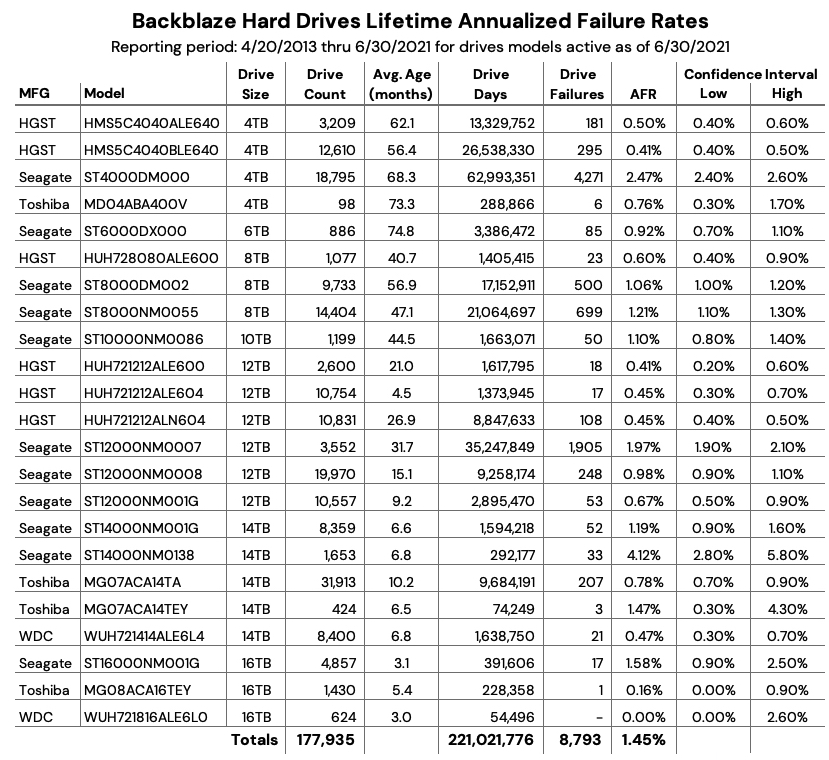
The chart below shows the lifetime AFR of all the HDD models in production as of June 30, 2021.
Notes and Observations on the Lifetime Stats
The lifetime AFR for all of the drives in our farm continues to decrease. The 1.45% AFR is the lowest recorded value since we started back in 2013. The drive population spans drive models from 4TB to 16TB and varies in average age from 3 months (WDC 16TB) to over 6 years (Seagate 6TB).
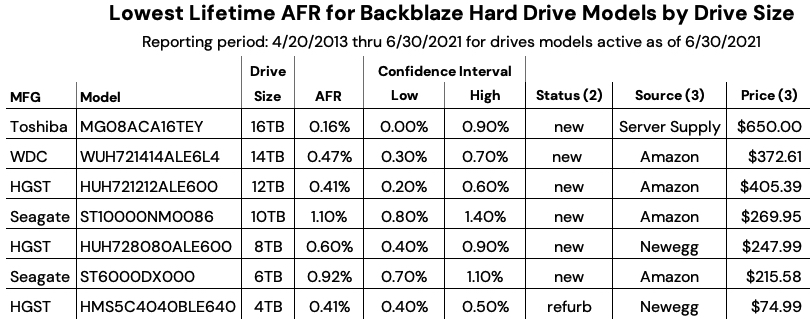
Our best performing drive models in our environment by drive size are listed in the table below.
Notes:
1 The WDC 16TB drive, model: WUH721816ALE6L0, does not appear to be available in the US through retail channels at this time.
2 Status is based on what is stated on the website. Further investigation may be required to ensure you are purchasing a new drive vs. a refurbished drive marked as new.
3 The source and price were as of July 30, 2021.
4 In searching for the Toshiba 16TB drive, model: MG08ACA16TEY, you may find model: MG08ACA16TE for much less ($399.00 or less). These are not the same drive and we have no information on the latter model. The MG08ACA16TEY includes the Sanitize Instant Erase feature.
The Drive Stats Data
The complete data set used to create the information used in this review is available on our HDD Test Data page. You can download and use this data for free for your own purpose.
If you just want the summarized data used to create the tables and charts in this blog post, you can download the ZIP file containing the CSV files for each chart.








 Subscribe to our free daily newsletter