


HDD Failure Rates Based on 129,764 HDDs Running at Backblaze
1.07%, lowest percentage for any quarter since 2013
This is a Press Release edited by StorageNewsletter.com on May 15, 2020 at 2:15 pm![]() This report was published on the blog of Backblaze, Inc. on May 12, 2020, written by Andy Klein, director of compliance.
This report was published on the blog of Backblaze, Inc. on May 12, 2020, written by Andy Klein, director of compliance.
Backblaze Hard Drive Stats Q1 2020
As of March 31, 2020, Backblaze had 132,339 spinning hard drives in our cloud storage ecosystem spread across four data centers. Of that number, there were 2,380 boot drives and 129,959 data drives. This review looks at the Q1 2020 and lifetime hard drive failure rates of the data drive models currently in operation in our data centers and provides a handful of insights and observations along the way. In addition, near the end of the post, we review a few 2019 predictions we posed a year ago. As always, we look forward to your comments.
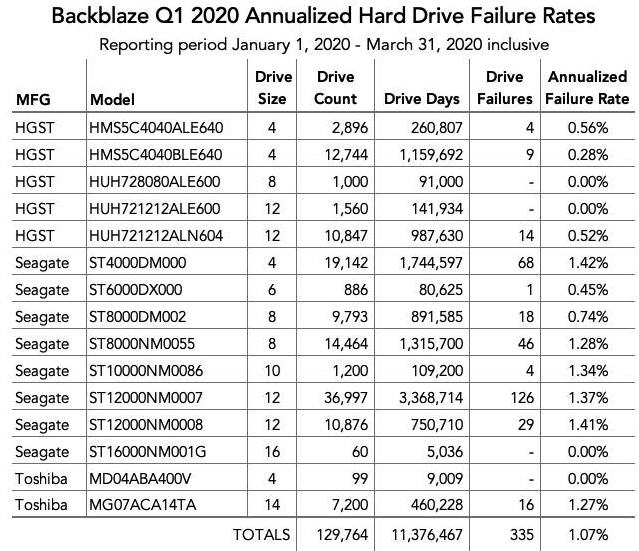
Hard Drive Failure Stats for 1Q20
At the end of 1Q20, Backblaze was using 129,959 hard drives to store customer data. For our evaluation we remove from consideration those drives that were used for testing purposes and those drive models for which we did not have at least 60 drives (see why below). This leaves us with 129,764 hard drives. The table below covers what happened in 1Q20.
Notes and Observations
The Annualized Failure Rate (AFR) for 1Q20 was 1.07%. That is the lowest AFR for any quarter since we started keeping track in 2013. In addition, the 1Q20 AFR is significantly lower than the 1Q19 AFR which was 1.56%.
During this quarter 4 drive models, from 3 manufacturers, had 0 drive failures. None of the Toshiba 4TB and Seagate 16TB drives failed in 1Q20, but both drives had less than 10,000 drive days during the quarter. As a consequence, the AFR can range widely from a small change in drive failures. For example, if just one Seagate 16TB drive had failed, the AFR would be 7.25% for the quarter. Similarly, the Toshiba 4TB drive AFR would be 4.05% with just one failure in the quarter.
On the contrary, both of the HGST drives with 0 failure in the quarter have a reasonable number of drive days, so the AFR is less volatile. If the 8TB model had 1 failure in the quarter, the AFR would only be 0.40% and the 12TB model would have an AFR of just 0.26% with 1 failure for the quarter. In both cases, the 0% AFR for the quarter is impressive.
There were 195 drives (129,959 minus 129,764) that were not included in the list above because they were used as testing drives or we did not have at least 60 drives of a given model. For example, we have: 20 Toshiba 16TB drives (model: MG08ACA16TA), 20 HGST 10TB drives (model: HUH721010ALE600), and 20 Toshiba 8TB drives (model: HDWF180). When we report quarterly, yearly, or lifetime drive statistics, those models with less than 60 drives are not included in the calculations or graphs. We use 60 drives as a minimum as there are 60 drives in all newly deployed Storage Pods.
That said, all the data from all of the drive models, including boot drives, is included in the files which can be accessed and downloaded on our Hard Drive Test Data webpage.
Computing the AFR
Throughout our reports we use the term Annualized Failure Rate. The word ‘annualized’ here means that regardless of the period of observation (month, quarter, etc.) the failure rate will be transformed into being an annual measurement. For a given group of drives (i.e. model, manufacturer, etc.) we compute the AFR for a period of observation as follows:
AFR=(Drive failures/(Drive days/366)*100
Where:
• Drive failures is the number of drives that failed during the period of observation.
• Drive days is the number of days all of the drives being observed were operational during the period of observation.
• There are 366 days in 2020, obviously in non-leap years we use 365.
Example: Compute the AFR for the drive Model BB007 for the last 6 months given;
• There were 28 drive failures during the period of observation (6 months).
• There were 6,000 HDDs at the end of the period of observation.
• The total number of days all of the drives model BB007 were in operation during the period of observation (6 months) totaled 878,400 days.
AFR=(28/(878,400/366))*100=(28/2,400)*100=1.17%
For the six 6-month period, model BB007 had an annualized failure rate of 1.17%.
But What About Drive Count?
Some of you may be wondering where ‘drive count’ fits into this formula? It doesn’t, and that bothers some folks. After all, wouldn’t it be easier to calculate the AFR as:
AFR=(Drive failures/Drive count)*(366/days in period of observation)*100
Let’s go back to our example in the previous paragraph. There were 6,000 hard drives in operation at the end of the period of observation; doing the math:
AFR=(28/6,000)*(366/183)*100=(0.00467)*(2)*100=0.93%
Using the drive count method, model BB007 had a failure rate of 0.93%. The reason for the difference is that Backblaze is constantly adding and subtracting drives.
New Backblaze Vaults come online every month; new features like S3 compatibility rapidly increase demand; migration replaces old, low capacity drives with new, higher capacity drives; and sometimes there are cloned and temp drives in the mix. The environment is very dynamic. The drive count on any given day over the period of observation will vary. When using the drive count method, the failure rate is based on the day the drives were counted. In this case, the last day of the period of observation. Using the drive days method, the failure rate is based on the entire period of observation.
In our example, the following table shows the drive count as we added drives over the 6-month period of observation:
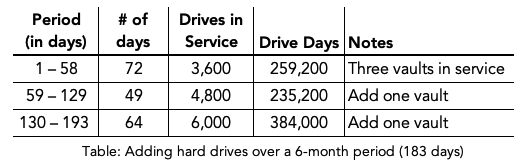
When you total up the number of drive days, you get 878,400, but the drive count at the end of the period of observation is 6,000. The drive days formula responds to the change in the number of drives over the period of observation, while the drive count formula responds only to the count at the end.
The failure rate of 0.93% from the drive count formula is significantly lower, which is nice if you are a drive manufacturer, but not correct for how drives are actually integrated and used in our environment. That’s why Backblaze chooses to use the drive days method as it better fits the reality of how our business operates.
Predictions from 1Q19
In the 1Q19 Hard Drive Stats review we made a few hard drive-related predictions of things that would happen by the end of 2019. Let’s see how we did.
- Prediction: Backblaze will continue to migrate out 4TB drives and will have fewer than 15,000 by the end of 2019: we currently have about 35,000.
• Reality: 4TB drive count as of December 31, 2019: 34,908.
• Review: We were too busy adding drives to migrate any. - Prediction: We will have installed at least 20x20TB drives for testing purposes.
• Reality: We have zero 20TB drives.
• Review: We have not been offered any 20TB drives to test or otherwise. - Prediction: Backblaze will go over 1EB of available cloud storage. We are currently at about 850PB of available storage.
• Reality: We announced 1EB in March of 2020https://www.backblaze.com/blog/exabyte-unlocked/, just past the end of 2019.
• Review: To quote Maxwell Smart, “Missed it by that much.” - Prediction: We will have installed, for testing purposes, at least 1xHAMR based drive from Seagate and/or 1xMAMR drive from Western Digital.
• Reality: Not a sniff of HAMR or MAMR drives.
• Review: Hopefully by the end of 2020.
In summary, I think I’ll go back to my hard drive statistics and leave the prognosticating to soothsayers and divining rods.
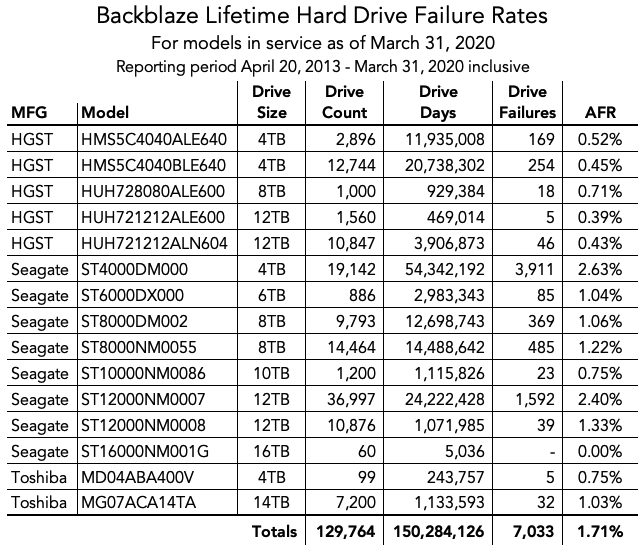
Lifetime Hard Drive Stats
The table below shows the lifetime failure rates for the hard drive models we had in service as of March 31, 2020. The reporting period is from April 2013 through December 31, 2019. All of the drives listed were installed during this timeframe.


 Subscribe to our free daily newsletter


