Backblaze: Fiscal 2Q25 Financial Results
Revenue of $36.3 million, Up 16% Y/Y, $36.7-$37.1 million expected next quarter and $145-$147 million for the full year.
This is a Press Release edited by StorageNewsletter.com on August 14, 2025 at 2:02 pmBackblaze, Inc. announced results for its 2nd quarter ended June 30, 2025.

“We’re pleased with our continued strong quarterly performance, with B2 revenue growth accelerating from 23% to 29% sequentially and solidifying our journey to be Adjusted Free Cash Flow positive in Q4,” said Gleb Budman, CEO, Backblaze. “We drove innovation with a suite of new cyber security data offerings announced in Q2 and Q3, including AI-powered ‘Anomaly Alerts,’ functionality designed to help customers detect potential suspicious activity. We also signed our first six-figure B2 Overdrive customer in early Q3, just 2 months after product launch, demonstrating the clear value our solutions bring to AI workloads. Through product innovation, go-to-market transformation, and the power of AI, we are expanding our role as the leading independent cloud storage provider shaping the AI-driven future.“
Second Quarter 2025 Financial Highlights:
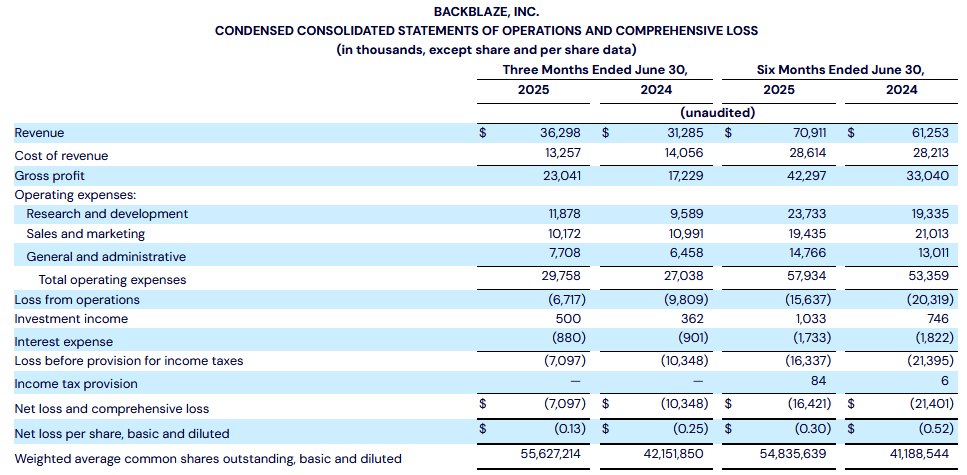
- Revenue of $36.3 million, an increase of 16% Y/Y.
- B2 Cloud Storage revenue was $19.8 million, an increase of 29% Y/Y.
- Computer Backup revenue was $16.5 million, an increase of 4% Y/Y.
- Gross profit of $23.0 million, or 63% of revenue, compared to $17.2 million, or 55% of revenue, in Q2 2024.
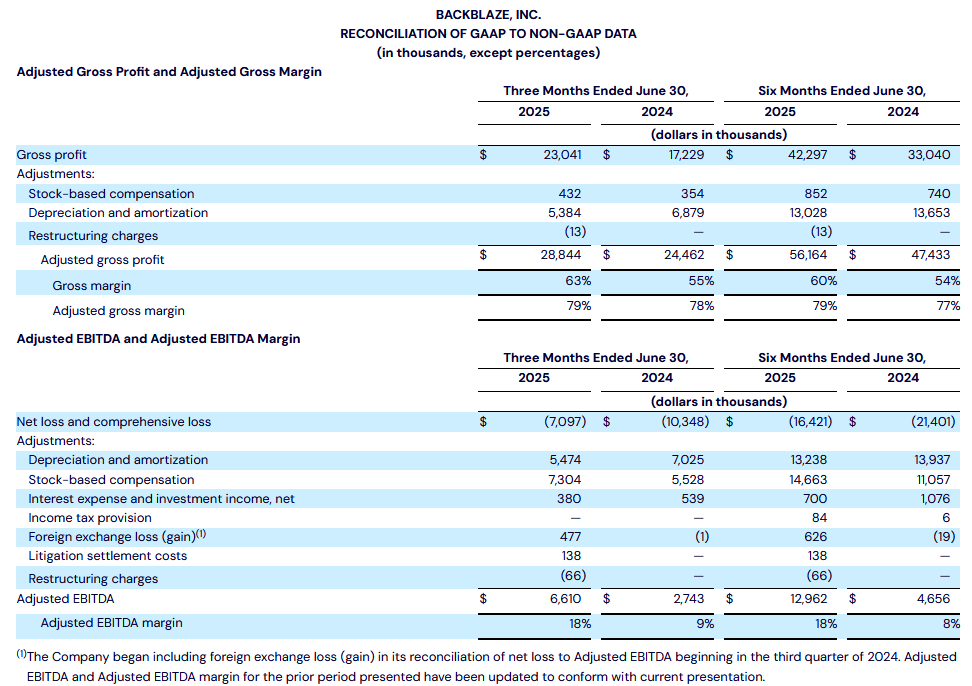
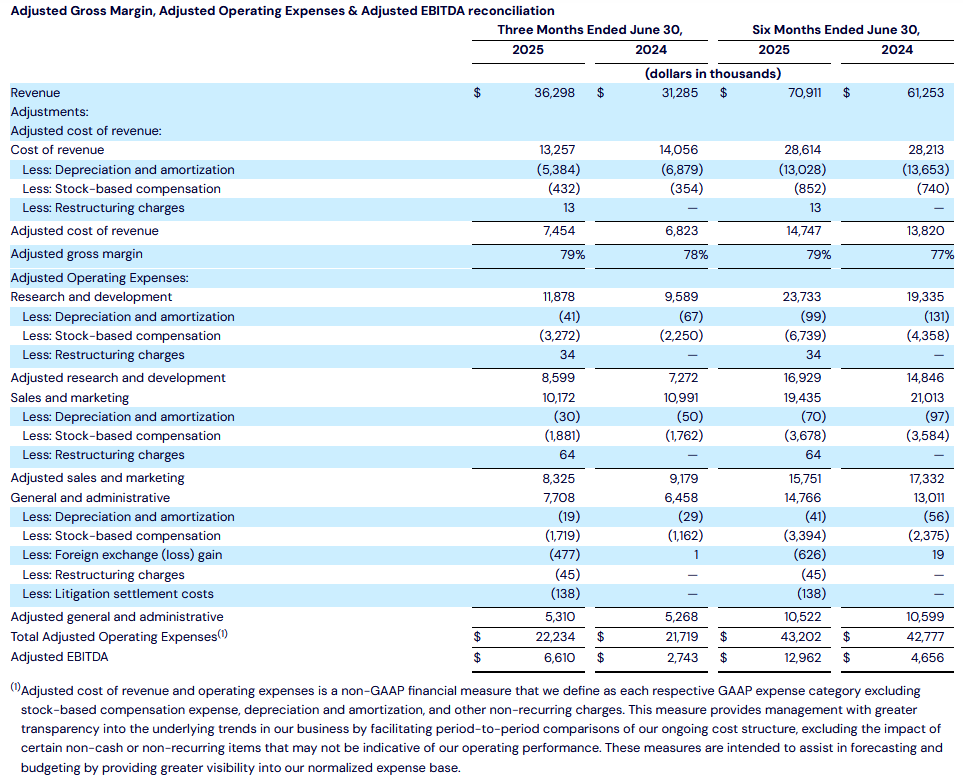
- Adjusted gross profit of $28.8 million, or 79% of revenue, compared to $24.5 million or 78% of revenue in Q2 2024.
- Net loss was $7.1 million compared to a net loss of $10.3 million in Q2 2024.
- Net loss per share was $0.13 compared to a net loss per share of $0.25 in Q2 2024.
- Adjusted EBITDA was $6.6 million, or 18% of revenue, compared to $2.7 million or 9% of revenue in Q2 2024.
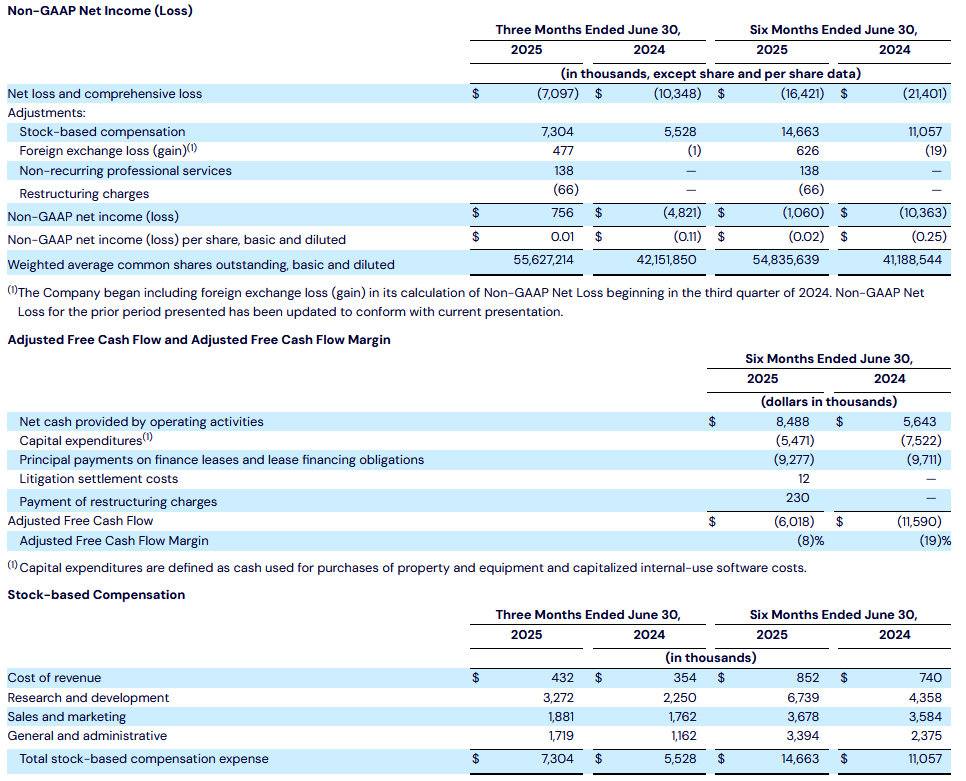
- Non-GAAP net income of $0.8 million compared to non-GAAP net loss of $4.8 million in Q2 2024.
- Non-GAAP net income per share of $0.01 compared to a non-GAAP net loss per share of $0.11 in Q2 2024.
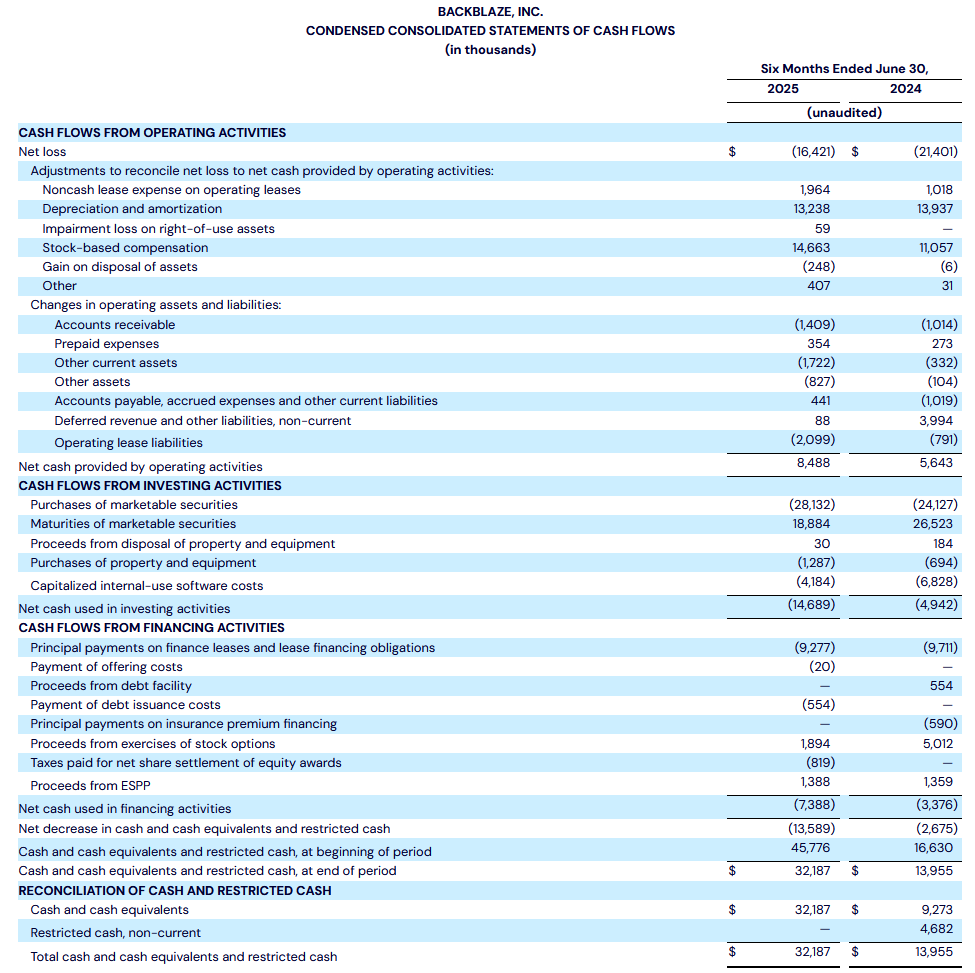
- Cash flow from operations during the six months ended June 30, 2025 was $8.5 million, compared to $5.6 million during the six months ended June 30, 2024.
- Adjusted free cash flow during the six months ended June 30, 2025 was $(6.0) million, compared to $(11.6) million in the six months ended June 30, 2024.
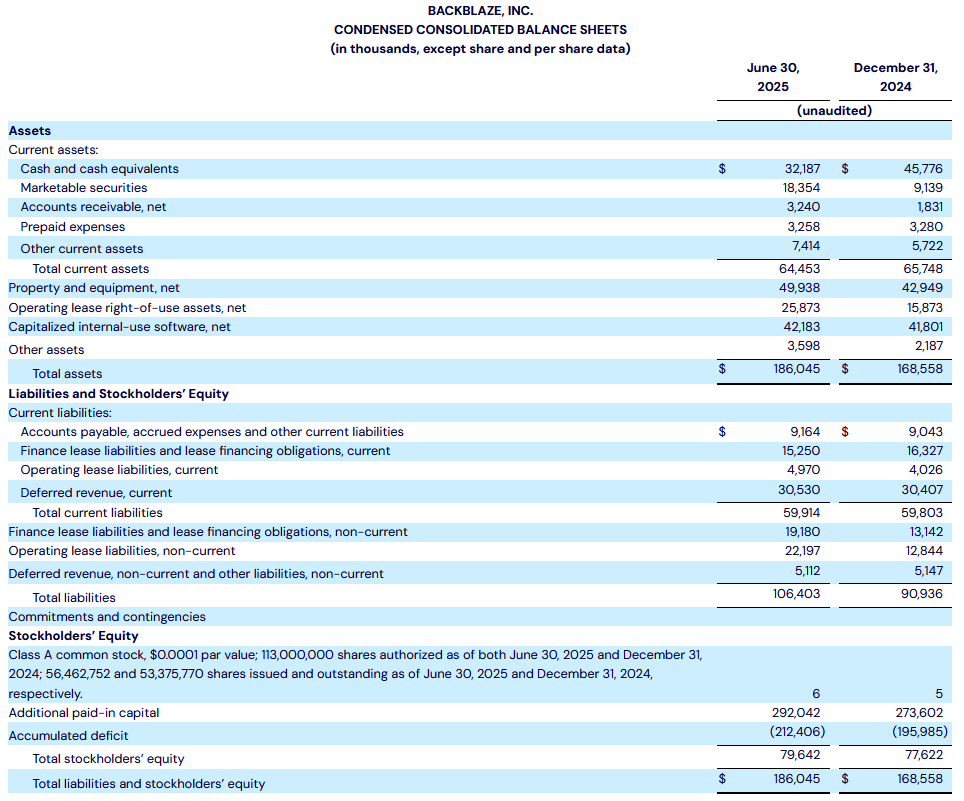
- Cash and marketable securities totaled $50.5 million as of June 30, 2025.
Second Quarter 2025 Operational Highlights:
- Annual recurring revenue (ARR) was $145.9 million, an increase of 16% Y/Y.
- B2 Cloud Storage ARR was $80.7 million, an increase of 29% Y/Y.
- Computer Backup ARR was $65.2 million, an increase of 3% Y/Y.
- Net revenue retention rate (NRR) was 109% compared to 114% in Q2 2024.
- B2 Cloud Storage NRR was 112% compared to 126% in Q2 2024.
- Computer Backup NRR was 106% compared to 105% in Q2 2024.
- Gross customer retention rate was 90% in both Q2 2025 and 2024.
- B2 Cloud Storage gross customer retention rate was 89% in both Q2 2025 and 2024.
- Computer Backup gross customer retention rate was 90% in both Q2 2025 and 2024.
Recent Business Highlights:
- Scaled an AI Customer to Over Several Million Dollars in ARR in Q2: Demonstrates the B2 platform’s inherent scalability and performance to accommodate customer’s rapid growth.
- Signed First B2 Overdrive Customer in Early Q3: This highlights the strong product-market fit of B2 Overdrive with AI use cases.
- Up-Market Momentum: Customers contributing over $50,000 in ARR grew 30% year over year in Q2.
- Launched a Suite of Enterprise Cyber Security Features in Q2 and Q3: Customers can further safeguard their data with Anomaly Alerts, Enterprise Web Console with role-based access control, and Bucket Access Logs.
- Backblaze B2 Up to 3.2x More Cost-Effective: Commissioned independent analyst firm, Enterprise Strategy Group, found B2 to be dramatically more cost-efficient and easy-to-use compared to alternatives.
- Authorized Cash-Neutral Stock Repurchase Program: Up to $10 million authorized, to be funded by cash proceeds from employee options exercised and purchases under our employee stock purchase plan.
- Secured New $20M Credit Facility: Enhancing financial flexibility and strategic capital access.
Financial Outlook Based on information available as of the date of this press release,
For the third quarter of 2025 we expect:
- Revenue between $36.7 million to $37.1 million.
- Adjusted EBITDA margin between 17% to 19%.
- Basic weighted average shares outstanding of 56.9 million to 57.0 million shares.
For full-year 2025 we expect:
- Revenue between $145.0 million to $147.0 million, which was raised from $144.0 million to $146.0 million previously.
- Adjusted EBITDA margin range of 17%-19%.
- For Y/Y growth in our B2 business, refer to table below:

Backblaze hosted a conference call on August 7, 2025 to review its financial results. An archive of the webcast is available.
Non-GAAP Financial Measures
To supplement the financial measures, which are prepared and presented in accordance with generally accepted accounting principles in the US (GAAP), we provide investors with non-GAAP financial measures including (i) adjusted gross profit (and margin), (ii) adjusted EBITDA and adjusted EBITDA margin, (iii) non-GAAP net income (loss) and non-GAAP net income (loss) per share, and (iv) adjusted free cash flow and adjusted free cash flow margin. These non-GAAP financial measures exclude certain items and are not prepared in accordance with GAAP; therefore, the information is not necessarily comparable to other companies and should be considered as a supplement to, not a substitute for, or superior to, the corresponding measures calculated in accordance with GAAP. We present these non-GAAP measures because management believes they are a useful measure of our performance and provide an additional basis for assessing our operating results. Please see the appendix attached to this press release for a reconciliation of non-GAAP adjusted gross margin and adjusted EBITDA margin to the most directly comparable GAAP financial measures.
A reconciliation of non-GAAP guidance measures to corresponding GAAP measures is not available on a forward-looking basis without unreasonable effort due to the uncertainty regarding, and the potential variability of, expenses and other factors in the future. For example, stock-based compensation expense-related charges are impacted by the timing of employee stock transactions, the future fair market value of our common stock, and our future hiring and retention needs, all of which are difficult to predict with reasonable accuracy and subject to constant change.
Adjusted Gross Profit and Margin
We believe adjusted gross profit (and margin), when taken together with our GAAP financial results, provides a meaningful assessment of our performance and is useful to us for evaluating our ongoing operations and for internal planning and forecasting purposes.
We define adjusted gross profit as gross profit, excluding stock-based compensation expense, depreciation and amortization and restructuring charges within cost of revenue. We define adjusted gross margin as a percentage of adjusted gross profit to revenue. We exclude stock-based compensation, which is a non-cash item, and restructuring charges because we do not consider it indicative of our core operating performance. We exclude depreciation expense of our property and equipment and amortization expense of capitalized internal-use software because these may not reflect current or future cash spending levels to support our business. We believe adjusted gross profit (and margin) provides consistency and comparability with our past financial performance and facilitates period-to-period comparisons of operations, as this metric eliminates the effects of depreciation and amortization.
Adjusted EBITDA and Adjusted EBITDA Margin
We define Adjusted EBITDA as net loss adjusted to exclude depreciation and amortization, stock-based compensation, interest expense, investment income, income tax provision, realized and unrealized gains and losses on foreign currency transactions, impairment of long-lived assets, restructuring charges, legal settlement costs, and other non-recurring charges. Adjusted EBITDA Margin is defined as Adjusted EBITDA divided by revenues for the period. We use Adjusted EBITDA and Adjusted EBITDA Margin to evaluate our ongoing operations and for internal planning and forecasting purposes. We believe that Adjusted EBITDA and Adjusted EBITDA Margin, when taken together with our GAAP financial results, provide meaningful supplemental information regarding our operating performance by excluding certain items that may not be indicative of our business, results of operations, or outlook. We consider Adjusted EBITDA and Adjusted EBITDA Margin to be important measures because they help illustrate underlying trends in our business and our historical operating performance on a more consistent basis.
Non-GAAP Net Income (Loss) and Non-GAAP Net Income (Loss) Per Share
We define non-GAAP net income (loss) as net income adjusted to exclude stock-based compensation, realized and unrealized gains and losses on foreign currency transactions, restructuring charges, legal settlement costs, and other items we deem non-recurring. Non-GAAP net income (loss) per share is defined as non-GAAP net income (loss) divided by basic and diluted weighted average common shares outstanding. We believe that non-GAAP net income (loss) and non-GAAP net income (loss) per share, when taken together with our GAAP financial results, provide meaningful supplemental information regarding our operating performance by excluding certain items that may not be indicative of our business, results of operations, or outlook.
Adjusted Free Cash Flow and Adjusted Free Cash Flow Margin
We believe that Adjusted Free Cash Flow and Adjusted Free Cash Flow Margin are useful metrics for assessing liquidity that provide information to management and investors about the cash generated from our core operations that can be reinvested in the business. However, these measures should not replace cash flows from operations as a liquidity benchmark. One limitation of these metrics is that they do not reflect our future contractual commitments, nor do they capture the overall changes in our cash balance during a specific period. Nonetheless, we believe that Adjusted Free Cash Flow and Adjusted Free Cash Flow Margin are key metrics providing insight into our financial trajectory that helps us make informed decisions as we work towards sustainable positive cash flow.
We define adjusted free cash flow as net cash provided by operating activities less purchases of property and equipment, capitalized internal-use software costs, principal payments on finance leases and lease financing obligations, as reflected in our consolidated statements of cash flows, and excluding payments on restructuring charges, payments on legal settlement costs, and payments on other non-recurring charges. Adjusted free cash flow margin is calculated as adjusted free cash flow divided by revenue.
Key Business Metrics:
Annual Recurring Revenue (ARR)
We define annual recurring revenue (ARR) as the annualized value of all Backblaze B2 and Computer Backup arrangements as of the end of a period. Given the renewable nature of our business, we view ARR as an important indicator of our financial performance and operating results, and we believe it is a useful metric for internal planning and analysis. ARR is calculated based on multiplying the monthly revenue from all Backblaze B2 and Computer Backup arrangements, which represent greater than 98% of our revenue for the periods presented for the last month of a period by 12. Our annual recurring revenue for Computer Backup and B2 Cloud Storage is calculated in the same manner as our overall annual recurring revenue based on the revenue from our Computer Backup and B2 Cloud Storage solutions, respectively.
Net Revenue Retention Rate (NRR)
To calculate the NRR for a specific quarter, we determine the revenue recognized in that quarter from customers who generated revenue during the same quarter of the previous year. This revenue is then divided by the revenue generated in the prior year quarter. Our overall NRR rate is calculated as the average of these quarterly rates over the past four quarters to provide a comprehensive view of revenue trends.
Gross Customer Retention Rate
We use gross customer retention rate to measure our ability to retain our customers. Our gross customer retention rate reflects only customer losses and does not reflect the expansion or contraction of revenue we earn from our existing customers. We believe our high gross customer retention rates demonstrate that we provide a vital service to our customers, as the vast majority of our customers tend to continue to use our platform from one period to the next. To calculate our gross customer retention rate, we take the trailing four-quarter average of our quarterly gross customer retention rates. We calculate the quarterly gross customer retention rates by dividing (i) the number of accounts that generated revenue in the last month of the current quarter that also generated recurring revenue during the last month of the corresponding quarter in the prior year, by (ii) the number of accounts that generated recurring revenue during the last month of the corresponding quarter in the prior year.




 Subscribe to our free daily newsletter

