 Nutanix: Fiscal 4Q24 Financial Results
Revenue up 11% Y/Y with huge net loss
This is a Press Release edited by StorageNewsletter.com on September 3, 2024 at 2:02 pmNutanix, Inc. announced financial results for its fourth quarter and fiscal year ended July 31, 2024.
“Our 4FQ24 was a solid finish to a fiscal year that showed good progress on our financial model with solid top line growth and sharp Y/Y improvement in profitability,” said Rajiv Ramaswami, president and CEO. “In FY24, we also made notable progress on partnerships, signing new or enhanced agreements with Cisco, Nvidia and Dell, and continued to innovate towards our goal of being the leading platform for running applications and managing data, anywhere.”
“Our FY24 results demonstrated a good balance of top and bottom line performance with 22% Y/Y ARR growth, strong free cash flow generation and our 1st full year of positive GAAP operating income,” said Rukmini Sivaraman, CFO. “We remain focused on delivering sustainable, profitable growth.”
1FQ25 Outlook
- Revenue between $565 and $575 million
- Non-GAAP operating margin between 14.5% and 15.5%
- Weighted average shares outstanding (diluted) approximately 287 million
FY25 Outlook
- Revenue between $2.435 and $2.465 billion
- Non-GAAP operating margin between 15.5% and 17.0%
- Free cash flow between $540 and $600 million
Comments

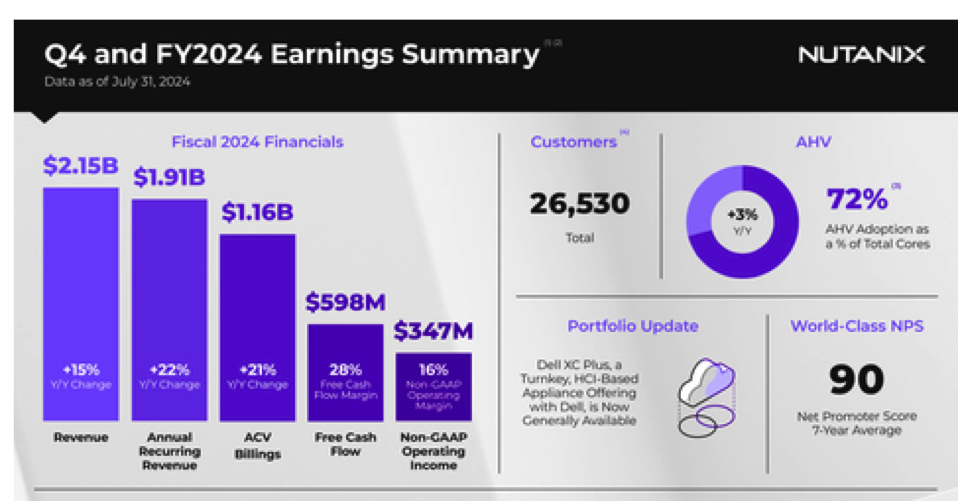
4FQ24 was a solid finish to FY24. The company continued to see steady demand for its solutions driven by businesses prioritizing infrastructure modernization initiatives, while looking to adopt hybrid multi-cloud operating models and optimize their total cost of ownership. In 4FQ24, it exceeded all of its guided metrics. It delivered quarterly revenue of $548 million, up 11% Y/Y, and saw another quarter of strong free cash flow generation. It also saw the highest number of new logos in 3 years, an encouraging sign of building traction with some of firm's go-to-market partnerships and initiatives.
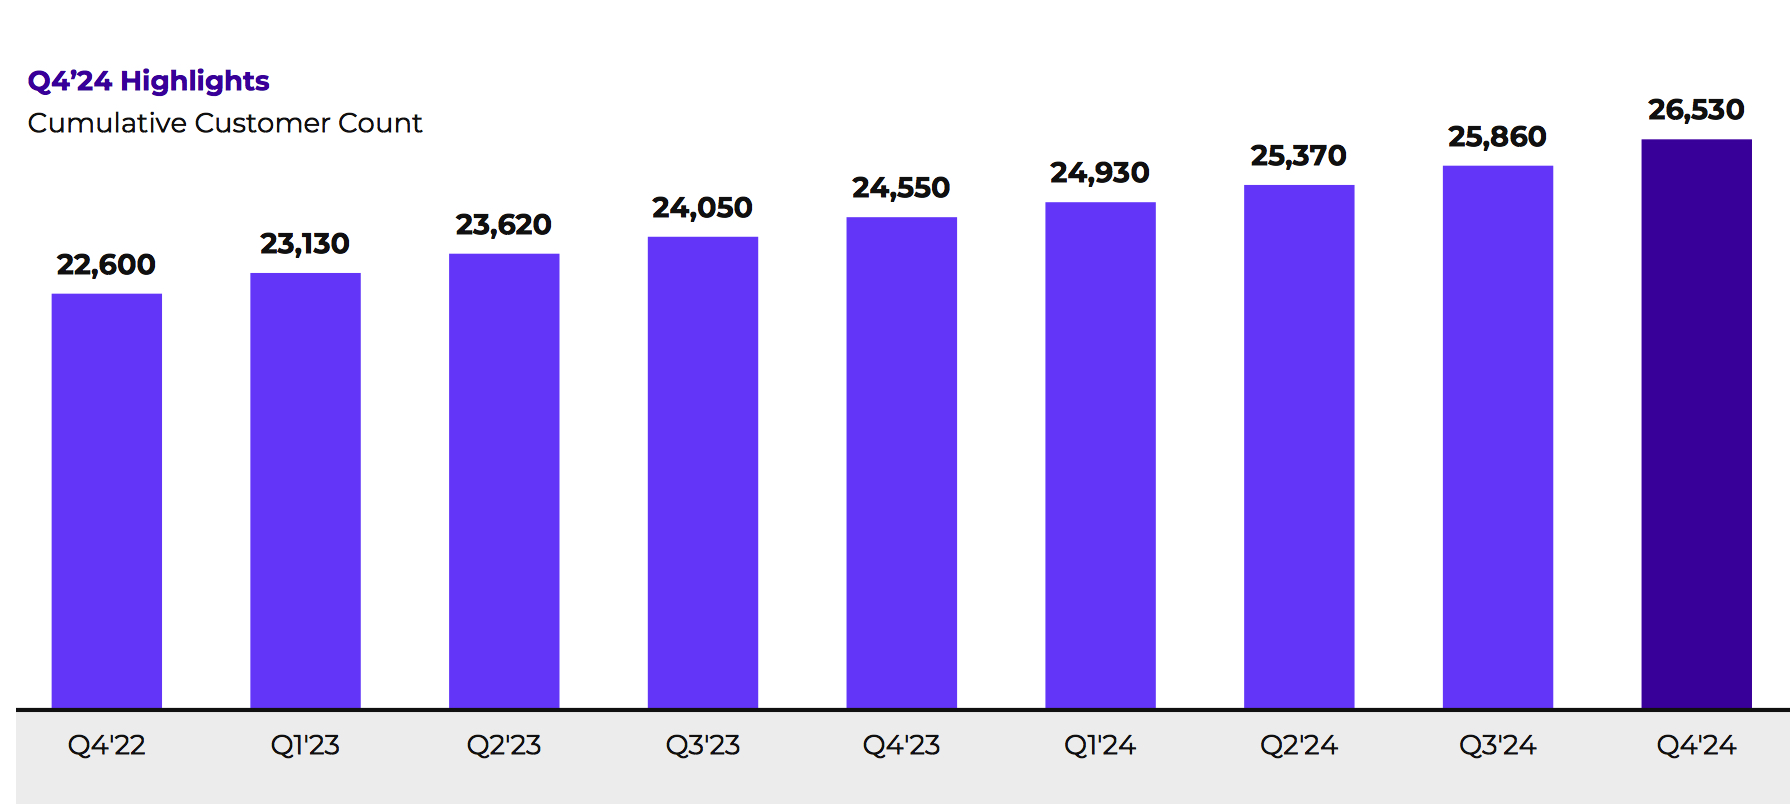
Customer growth

ACV billings in 4FQ24 were $338 million above the guided range of $295 million to $305 million, representing Y/Y of 21%.
Moving to the balance sheet, Nutanix ended 4FQ24 with cash, cash equivalents and short-term investments of $994 million, down from $1.651 billion at the end of 3FQ24.
It generated free cash flow of $598 million, almost 3x higher than last year.
Revenue and net income (loss)
(in $ million)
| FY ended in July | Revenue | Y/Y growth | Q/Q growth | Net income (loss) |
| FY12 | 6.6 | NA | (14.0) | |
| FY13 | 30.5 | 362% | (44.7) | |
| FY14 | 127.1 | 317% | (84.0) | |
| FY15 | 241.4 | 90% | (126.1) | |
| FY16 | 444.9 | 84% | (168.5) | |
| FY17 | 845.9 | 90% | (379.6) | |
| FY18 | 1155 | 14% | (297.2) | |
| FY19 | 1136 | -2% | (621.2) | |
| FY20 | 1308 | 15% | (872.9) | |
| FY21 |
1,394 | 7% | (1,034) | |
| FY22 |
1,581 | 13% | (797.5) | |
| FY23 |
1,863 | 18% | (254.6) | |
| 1FQ24 |
511.1 | 15% | 3% | (15.9) |
| 2FQ24 |
565.2 | 16% | 11% | 32.8 |
| 3FQ24 | 524.6 | 17% | -7% | (15.5) |
| 4FQ24 | 548.0 | 11% | 4% | (126.1) |
| 1FQ25 (estim.) | 565-575 | 10%-13% | 3%-5% | NA |
| FY25 (estim.) |
2,435-2,465 | 31%-32% | NA | NA |
($238 million IPO in 2016)


 Subscribe to our free daily newsletter

