


 Quantum: Fiscal 4Q24 Financial Results
Disaster, currently and tomorrow, FY24 sales at $312 million down 24% Y/Y; losing top customer
This is a Press Release edited by StorageNewsletter.com on June 19, 2024 at 2:02 pm| (in $ million) | 12 mo. 23 | 12 mo. 24 |
| Revenue | 422.1 | 311.7 |
| Growth | -26% | |
| Net income (loss) | (18.4) | (41.3) |
Quantum Corporation announced financial results for its fiscal full year 2024 ended March 31, 2024.
FY24 Financial Summary
- Revenue was $311.6 million
- GAAP gross profit was $124.9 million, or 40% of revenue
- GAAP net loss was $41.3 million, or ($0.43) per share
- Annual recurring revenue (ARR) was $145 million
- Subscription ARR was up 33% Y/Y at $17.8 million
- •Adjusted non-GAAP net loss was $27.5 million, or ($0.29) per share
- •Adjusted EBITDA was ($5.3) million
“Following the recent completion of our financial re-evaluation process, we are pleased to be back discussing our operations and financials, including results for FY24,” stated Jamie Lerner, chairman and CEO. “Although this comprehensive process was time-intensive, it demonstrates our commitment to the highest standards of financial integrity and transparency. The financial restatement adjustments made were all technical accounting in nature and we found no evidence of intentional misconduct.
“Our FY24 results reflect a significant reduction of revenue from our largest hyperscale customer, which we had expected would scale down over time but instead stopped placing orders at the end of 1FQ24. While extremely disappointed with the impact from significantly lower revenue Y/Y, we have been proactively accelerating our business transformation. During this time, our team continues to focus on improving the company’s capital structure as well as optimizing our overall business operations.
“These actions include improved focus and retooling of our sales and product initiatives in strategic growth areas; accelerating operational efficiencies and cost reductions to achieve $16 million of total annualized savings; year-over-year gross margin improvement of over 600 basis points; and strengthening our capital structure through balance sheet optimization, sale of non-core assets, and debt reduction. A recent example of these actions in motion, subsequent to fiscal year-end, was completing a transaction to reduce liabilities and carrying costs through the sale of service inventory assets. Then using the proceeds to pay down outstanding debt. Additionally, we have active efforts to restructure and shift resources to leverage our international footprint and to expand our channel partner network in Asia and North America.
“Looking ahead, we remain committed to getting back to profitability as well as stabilizing and improving the performance of our legacy Automation and StorNext solutions. Quantum remains dedicated to use cases for M&E, life sciences, industrial technology, and federal while improving our position to address the prevailing industry trends around AI across the multiple verticals we serve. ActiveScale and Myriad will be the center of our growth strategy by serving use cases that drive higher recurring revenue, with improved margins, in faster growing market segments. Execution of our strategy to advance our operating model, combined with improving our capital structure, will drive step-change improvements to Quantum in FY25.”
FY24 vs. FY23
- Revenue of $311.6 million for FY24 decreased 26.2% from $422.1 million in FY23, primarily reflecting lower revenue contribution from hyperscale customers combined with lower tape media and royalty business.
- Gross profit in FY24 was $124.9 million, or 40.1% of revenue, compared to $143.3 million, or 33.9% of revenue, in FY23.
- Total GAAP operating expenses in FY24 were $153.8 million, or 49.3% of revenue, compared to $159.9 million, or 37.9% of revenue, in FY23.
- Selling, general and administrative expenses were $112.4 million in FY24, compared to $113.8 million in FY23.
- R&D expenses were $38.0 million in FY24, compared to $44.6 million in FY23. Non-GAAP operating expenses in FY24 were $136.1 million, compared to $142.9 million in FY23.
- GAAP net loss in FY24 was $41.3 million, or ($0.43) per share basic and diluted, compared to a net loss of $18.4 million, or ($0.20) per share basic and ($0.28) per share diluted, in FY23. Excluding the income statement impact of the warrants, stock compensation, restructuring charges, and other non-recurring costs, non-GAAP adjusted net loss in FY24 was $27.5 million, or ($0.29) per share basic and diluted, compared to an adjusted net gain of $3.2 million, or $0.04 per share basic and $0.03 per share diluted, in FY23.
- Adjusted EBITDA in fiscal 2024 was ($5.3) million, compared to $21.1 million in FY23.
Liquidity and Debt (as of March 31, 2024)
- Cash, cash equivalents and restricted cash were $25.9 million, compared to $26.2 million as of March 31, 2023.
- Total interest expense for 4FQ24 and FY24 were $4.1 million and $15.1 million, respectively, compared to $3.0 million and $10.6 million for the same periods a year ago.
- Outstanding term loan debt, excluding debt issuance costs, was $87.9 million, compared to $74.7 million as of March 31, 2023. Outstanding borrowings on revolving credit facility was $26.6 million, compared to $16.8 million as of March 31, 2023.
Subsequent to quarter end, the company paid down $12.3 million of term loan debt through improved working capital by outsourcing our service inventory logistics and management.
For 1FQ25, the company expects:
- Revenue of $72.0 million, ±$2.0 million
- Non-GAAP adjusted basic net loss per share of ($0.09), ±$0.02
- Adjusted EBITDA of approximately ($2.0) million
For FY25, it expects:
- Revenue at $310 million, ±$10.0 million
- Non-GAAP adjusted basic earnings per share of ($0.10), ± $0.05
- Adjusted EBITDA of $15.0 million, ± $5.0 million
This assumes an effective annual tax rate of negative 14%; non-GAAP adjusted net loss per share assumes an average basic share count of approximately 96 million in 1FQ25 and approximately 96.4 million for FY25.
Comments
One year ago or in 4FQ23, Quantum recorded its strongest FQ4 revenue since FY17 at $105.3 million, down 5% Q/Q and up 11% Y/Y, but it didn't reveal quarterly results for FY24.
This financial announcement was late following the recent completion of firm's financial re-evaluation process.
In FY24, Quantum expects lowest FY revenue since 1998.
With revenue declining approximately $110.5 million Y/Y in 1FQ24, overall gross profit was down approximately $18.4 million year over year.
This bad results are mainly explained by the loss of top first customer during the quarter, and also partially by the decrease of royalties from tape business.
Annual Recurring Revenue Analysis
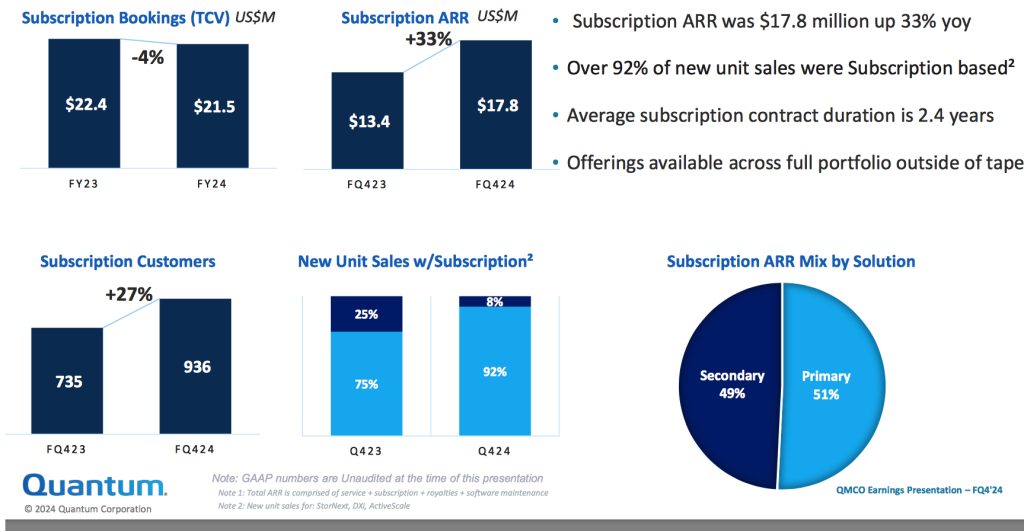
Total annual recurring revenue or ARR for FY24 was approximately 46% of total revenue at $144.9 million, with the gross margin on this revenue being approximately 65%.
In FY24, the subscription portion of total ARR increased approximately 33% Y/Y to approximately $17.8 million. The company continues to see strong implementation of its subscription offering with over 92% of new customers on subscription.
Revenue in 1FQ25 is expected to be between $70 and 74 million and will be probably historically the lowest figure for any 3-month period.
In terms of targeted outlook for FY25, the firm anticipates revenue to be essentially flat Y/Y at approximately $360 million, ±$10 million, which reflects the reduced baseline business for both media and hyperscale solutions. Partially offsetting the lower revenue from legacy solutions, it anticipates increased demand for higher-margin ActiveScale, StorNext, and Myriad products.
It also anticipates its efforts will deliver Y/Y improvements in profitability and operating structure in FY25.
To accelerate these efforts, Quantum engaged the external firm, FTI, to assist in this journey.
Fiscal year ended March 31
| (in $ million) | Revenue | Y/Y Growth | Net income (loss) |
| 1998 | 1,189.8 | NA |
170.8 |
| 1999 | 1,302.7 | 9% | (29.5) |
| 2000 | 1,418.9 | 9% | 40.8 |
| 2001 | 1,405.8 | -1% | 160.7 |
| 2002 | 1,087.8 | -23% | 42.5 |
| 2003 | 870.8 | -20% | (264.3) |
| 2004 | 808.3 | -7% | (62.0) |
| 2005 | 794.2 | -2% | (3.5) |
| 2006 | 834.3 | +5% | (41.5) |
| 2007 | 1,016.2 | +22% | (64.1) |
| 2008 | 975.7 | -4% | (60.2) |
| 2009 | 809.0 | -17% | (356.1) |
| 2010 | 681.4 | -16% | 16.6 |
| 2011 | 672.3 | -1% | 4.5 |
| 2012 | 652.4 | -3% | (8.8) |
| 2013 | 587.6 | -10% | (52.4) |
| 2014 | 553.2 | -6% | (21.5) |
| 2015* | 543.7 | -2% | 15.4 |
| 2016* | 479.8 | -12% | (75.6) |
| 2017* | 493.1 | 3% | (2.4) |
| 2018 |
437.7 |
-11% | (43.3) |
| 2019 |
402.7 |
-8% | (42.8) |
| 2020 |
402.9 |
0% | (5.2) |
| 2021 |
349.6 |
-13% | (35.5) |
| 1FQ22 |
89.1 | 22% | (4.2) |
| 2FQ22 |
93.2 |
9% | (9.3) |
| 3FQ22 |
95.3 |
-3% | (2.7) |
| 4FQ22 |
95.2 | 3% | (7.8) |
| FY22 |
372.8 |
7% | (32.3) |
| 1FQ23 |
97.1 | 9% | (10.6) |
| 2FQ23 |
99.1 | 6% | (11.9) |
| 3FQ23 |
111.2 | 15% | (2.2) |
| 4FQ23 |
105.3 | 11% | (13.6) |
| FY23 |
412.8 |
11% | (37.9) |
| FY24 |
311.7 | -26% | (41.3) |
| 1FQ25 (estim.) | 70-74 | NA | NA |
| FY25 (estim.) | 300-320 | -4% -3% | NA |
* figures as restated


 Subscribe to our free daily newsletter


