 Netapp: Fiscal 3Q24 Financial Results
Sales up 5% Y/Y during quarter pushed by AFA with net income continuing to increase
This is a Press Release edited by StorageNewsletter.com on March 4, 2024 at 2:02 pm| (in $ million) | 3Q23 | 3Q24 | 9 mo. 23 | 9 mo. 24 |
| Revenue | 1,526 | 1,606 | 4,781 | 4,600 |
| Growth | 5% | -4% | ||
| Net income (loss) | 65 | 313 | 1,029 | 695 |
NetApp, Inc. reported financial results for the third quarter of fiscal year 2024, which ended on January 26, 2024.
“In 3FQ24, our focused execution and continued operational discipline delivered solid revenue growth and again yielded company all-time highs across key profitability metrics,” said George Kurian, CEO. “Our modern approach to unified data storage, spanning all-flash and cloud environments, is clearly resonating with customers. I am confident in our ability to capitalize on this momentum, as we address new market opportunities, extend our leadership position in existing markets, and deliver increasing value for all our stakeholders.“
3FQ24 financial results
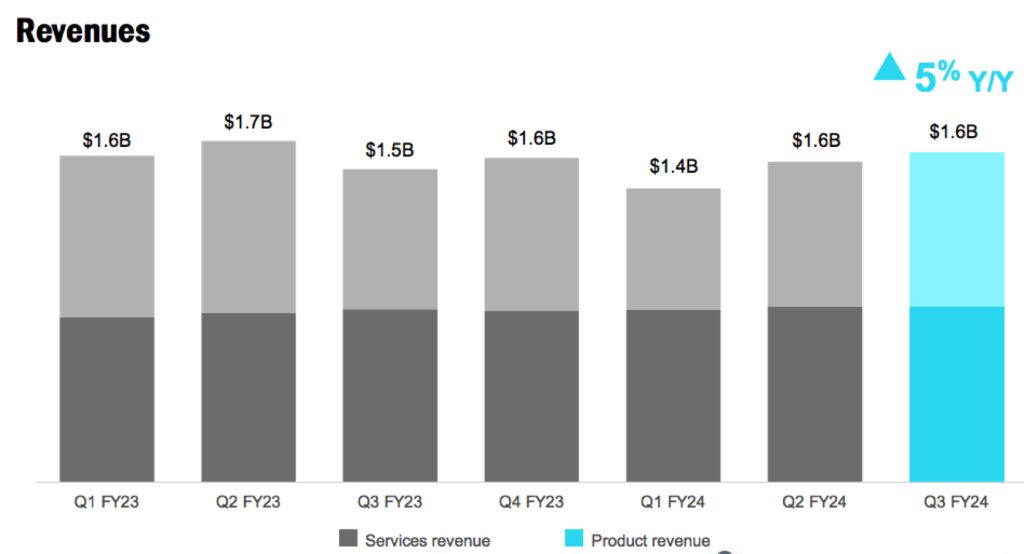
- Net revenue: $1.61 billion, compared to $1.53 billion in the 3FQ23, a Y/Y increase of 5%.
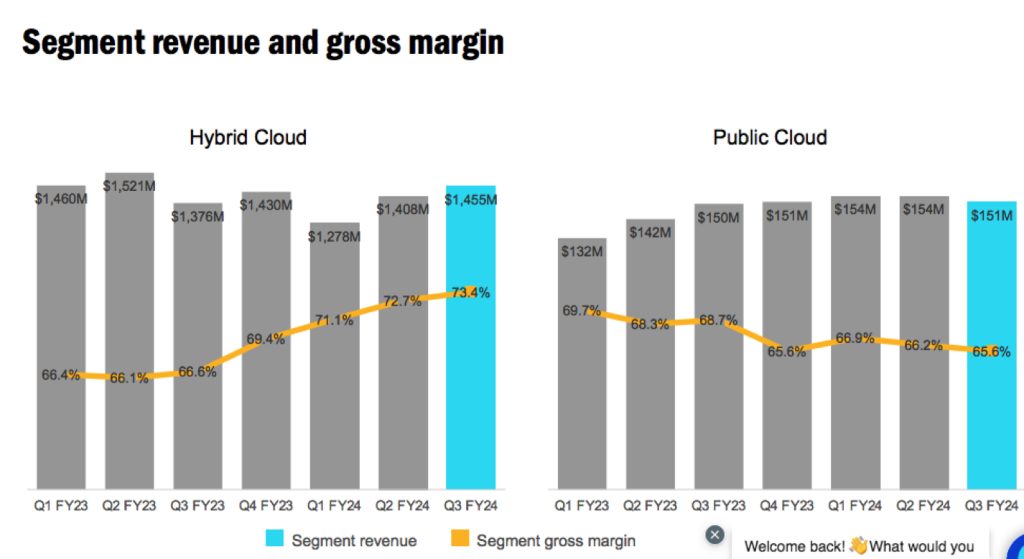
- Hybrid Cloud segment revenue: $1.46 billion, compared to $1.38 billion in 3FQ23.
- Public Cloud segment revenue: $151 million, compared to $150 million in 3FQ23.
- Billings: $1.69 billion, compared to $1.57 billion in 3FQ23; a Y/Y increase of 7%.
- Public Cloud ARR: $608 million, compared to $605 million in 3FQ23; relatively flat Y/Y.
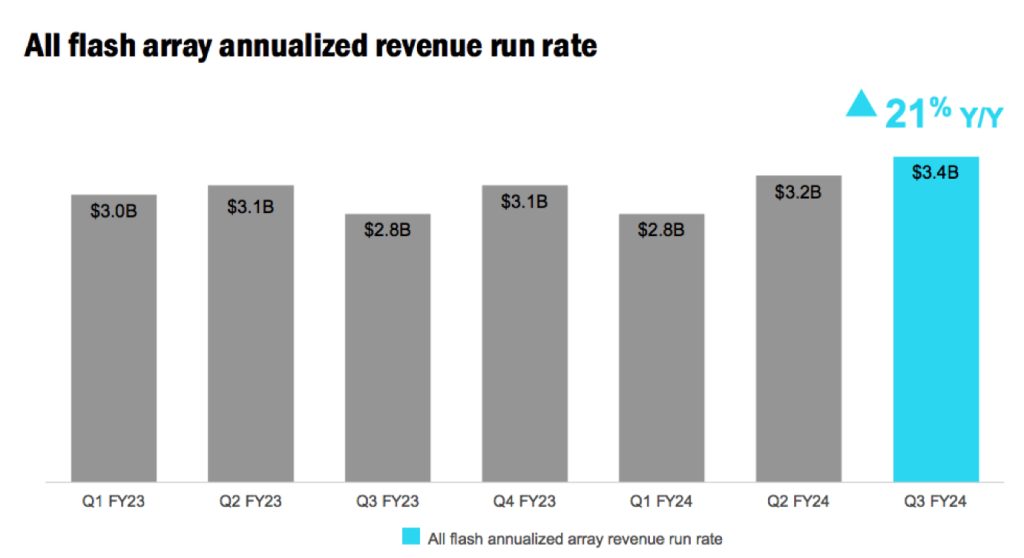
- AFA ARR: $3.4 billion, compared to $2.8 billion in 3FQ23; a Y/Y increase of 21%.
- Net income: GAAP net income of $313 million, compared to $65 million in 3FQ23; non-GAAP net income2 of $410 million, compared to $301 million in 3FQ23.
- Earnings per share: GAAP net income per share of $1.48, compared to $0.30 in 3FQ23; non-GAAP net income per share of $1.94, compared to $1.37 in 3FQ23.
- Cash, cash equivalents and investments: $2.92 billion at the end of 3FQ24.
- Cash provided by operations: $484 million, compared to $377 million in 3FQ23.
- Share repurchase and dividends: Returned $203 million to stockholders through share repurchases and cash dividends.
The next cash dividend of $0.50 per share is to be paid on April 24, 2024, to stockholders of record as of the close of business on April 5, 2024.
4FQ24 financial outlook
Net revenue in the range of: $1.585 billion – $1.735 billion
FY24 financial outlook
Net revenues are expected in the range of $6.185 billion – $6.335 billion
Comments
Despite an uncertain macro environment, revenue was above the midpoint of guidance ($1.51-$1.67 billion), driven by the momentum of firm's expanded all-flash product portfolio.


NetApp delivered robust Y/Y performance in its Hybrid Cloud segment with revenue growth of 6% and product revenue growth of 10%, driven by momentum from its newly introduced all-flash products and the go-to-market changes made at the start of the year.
Strong customer demand for company's all-flash solutions drove all-flash growth of 21% Y/Y to an all-time high ARR rate of $3.4 billion.

In 3FQ24, all-flash business expanded to approximately 60% of Hybrid Cloud segment revenue and the company expects a sustainable step up in its baseline product gross margin going forward with the continued revenue shift to all-flash.
The AFF C-series all-flash arrays again exceeded expectations, delivering new customers and numerous wins over the competition. As customers modernize legacy 10,000rpm HDDs and hybrid flash environments, the manufacturer is displacing competitors’ installed bases with its all-flash solutions, driving share gains.
Public Cloud segment revenue was $151 million, up 1% Y/Y. First party and hyperscaler marketplace storage services remain company's priority and are growing rapidly, with the ARR of these services up more than 35% Y/Y.
In 4FQ24, the form expects revenue to range between $1.585 and $1.735 billion, which at the midpoint of $1.66 billion implies an increase of 5% Y/Y.
For FY24 estimation is not so good: between 6,185 and 6,335 or between -3% and -0%.
NetApp's financial results since FY16 in $ million
| Fiscal Period | Revenue | Y/Y Growth | Net income (loss) |
| FY16 | 5,546 | -9% | 229 |
| FY17 | 5,519 | -0% | 509 |
| FY18 | 5,911 | 7% | 75 |
| FY19 |
6,146 | 4% |
1,169 |
| FY20 |
5,412 | -12% |
819 |
| FY21 | 5,744 | 6% | 730 |
| 1Q22 |
1,458 | 12% | 202 |
| 2Q22 |
1,566 | 11% | 292 |
| 3Q22 |
1,614 | 10% | 252 |
| 4Q22 | 1,680 | 8% | 259 |
| FY22 | 6,318 | 10% | 937 |
| 1Q23 |
1,592 | 9% | 214 |
| 2Q23 |
1,663 | 6% | 750 |
| 3Q23 | 1,526 | -5% | 65 |
| 4Q23 | 1,581 | -6% | 334 |
| FY23 |
6,362 | 1% |
1,230 |
| 1FQ24 |
1,432 | -10% | 149 |
| 2Q24 |
1,562 | -6% | 230 |
| 3FQ24 |
1,606 | 5% | 313 |
| 4FQ24 (estim.) | 1,585-1,735 | 0%-10% | NA |
| FY24 (estim.) |
6,185-6,335 | -3% - -0% |
NA |


 Subscribe to our free daily newsletter
