


 Western Digital: Fiscal 2Q24 Financial Results
Sales up 10% Q/Q and down 2% Y/Y, not profitable
This is a Press Release edited by StorageNewsletter.com on January 26, 2024 at 2:02 pm| (in $ million) | 2Q23 | 2Q24 | 6 mo. 23 | 6 mo. 24 |
| Revenue | 3,107 | 3,032 | 6,843 | 5,782 |
| Growth | -2% | -16% | ||
| Net income (loss) | (446) | (268) | (419) | (953) |
News Summary
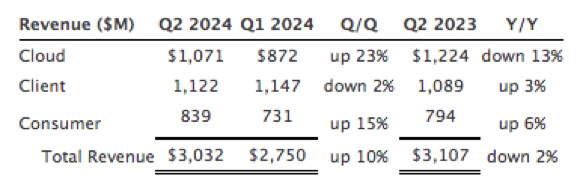
- 2FQ24 revenue was $3.03 billion, up 10% Q/Q. Cloud revenue increased 23% Q/Q, client revenue decreased 2% (Q/Q) and consumer revenue increased 15% Q/Q.
- 2FQ24 GAAP earnings per share (EPS) was $(0.87) and non-GAAP EPS was $(0.69), which includes $156 million of underutilization-related charges in flash and HDD.
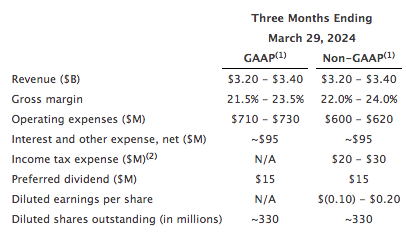
- Expect 3FQ24 revenue to be in the range of $3.20 billion to $3.40 billion.
- Expect Non-GAAP EPS in the range of $(0.10) to $0.20, which includes $30 to $40 million of underutilization-related charges in HDD.
Western Digital Corp. reported fiscal second quarter 2024 financial results.
“Western Digital’s second quarter results demonstrate that the structural changes we have put in place over the last few years and the strategy we have been executing are producing significant outperformance across our flash and HDD businesses,” said David Goeckeler, CEO. “We are seeing our efforts come to fruition as our financial performance met, or exceeded, the non-GAAP guidance ranges we provided in October, and I am confident that our strategy of managing inventory proactively, offering a broad range of products, closely controlling our product cost through focused R&D and manufacturing, and bolstering the agility of our business will allow us to improve through-cycle profitability and dampen business cycles into the future.”
The company had an operating cash outflow of $92 million and ended the quarter with $2.48 billion of total cash and cash equivalents.
End Market Summary
In 2FQ24:
- Cloud represented 35% of total revenue. Sequentially, the growth was attributed to higher nearline shipments to data center customers and better nearline pricing. The Y/Y decrease was due to lower eSSD bit shipments.
- Client represented 37% of total revenue. Sequentially, an increase in flash ASPs was more than offset by a decline in flash bit shipments. The Y/Y increase was due to higher flash shipments, primarily driven by client SSD shipments into PC applications, more than offsetting a decline in flash ASPs.
- Consumer represented 28% of total revenue. Sequentially, the growth was primarily due to seasonal strength in flash bit shipments. On a Y/Y basis, the increase in flash bit shipments was partially offset by a decline in flash ASPs as well as lower HDD shipments.
Business Outlook for 3FQ24
Comments
| in $ million | 4FQ21 |
1FQ22 |
2FQ22 |
3FQ22 |
4FQ22 |
1FQ23 | 2FQ23 | 3FQ23 |
4FQ23 | 1FQ24 |
4FQ23/1FQ24 growth |
| HDDs |
2,501 | 2,561 | 2,213 | 2,138 | 2,128 | 2,014 | 1,657 | 1,496 | 1,295 |
1,194 |
-8% |
| Flash |
2,419 | 2,490 | 2,620 | 2,243 | 2,400 | 1,722 | 1,450 | 1,307 | 1,377 | 1,556 |
13% |
By business, and HDD
| Client revenue (1) |
Cloud revenue (1) |
Consumer revenue (1) |
Total HDDs (2) |
HDD ASP |
|
| 1FQ22 |
1,853 | 2,225 | 973 | 24.1 |
$102 |
| 2FQ22 |
1,854 | 1,920 | 1,059 | 21.6 |
$97 |
| 3FQ22 |
1,732 | 1,774 | 875 | 19.8 |
$101 |
| 4FQ22 |
1,637 | 2,098 | 793 | 16.5 |
$120 |
| 1FQ23 |
1,229 | 1,829 | 678 | 14.7 | $125 |
| 2FQ23 |
1,089 | 1,224 | 794 | 12.9 | $99 |
| 3FQ23 |
975 | 1,205 | 623 | 12.6 | $109 |
| 4FQ23 |
1,035 | 994 | 643 | 11.8 | $99 |
| 1FQ24 |
1,147 | 872 | 731 | 10.4 | $112 |
Comparison of Seagate and WD for their more recent financial quarters
| WD | Seagate | % in favor of WD | |
| Revenue | 3,032 | 1,454 | 89% |
| Y/Y Growth | -2% | -29% | |
| Net loss | (268) | 184 | |
| Flash revenue | 159 | 979% | |
| Y/Y growth | -40% | ||
| HDD revenue | 1,295 | -8% | |
| Y/Y growth | -27% | ||
| Total HDDs shipped | 11.9 million | 39% | |
| HDD ASP | $108 | 4% |
Earnings call transcript


 Subscribe to our free daily newsletter


