 Dropbox: Fiscal 1Q23 Financial Results
$611 million revenue, up 9% Y/Y, and profitable
This is a Press Release edited by StorageNewsletter.com on May 5, 2023 at 2:02 pmDropbox, Inc. announced financial results for its first quarter ended March 31, 2023.
“We’re pleased with our financial results in 1Q23, beating our guidance across all metrics,” said co-founder and CEO Drew Houston. “While the economic backdrop remains tough for our existing businesses, the AI era of computing has arrived and we see a huge opportunity to apply AI/ML to our products to transform knowledge work. I’m committed to ensuring Dropbox is at the forefront of this era and excited to bring more AI-powered products to market for our customers.“
1FQ23 Results
• Total revenue was $611.1 million, an increase of 8.7% from 1FQ22. On a constant currency basis, Y/Y growth would have been 11.6%.
• Total ARR ended at $2.468 billion, an increase of 7.8% from 1FQ22. On a constant currency basis, Total ARR grew $37.5 million Q/Q, and Y/Y growth would have been 11.6%.
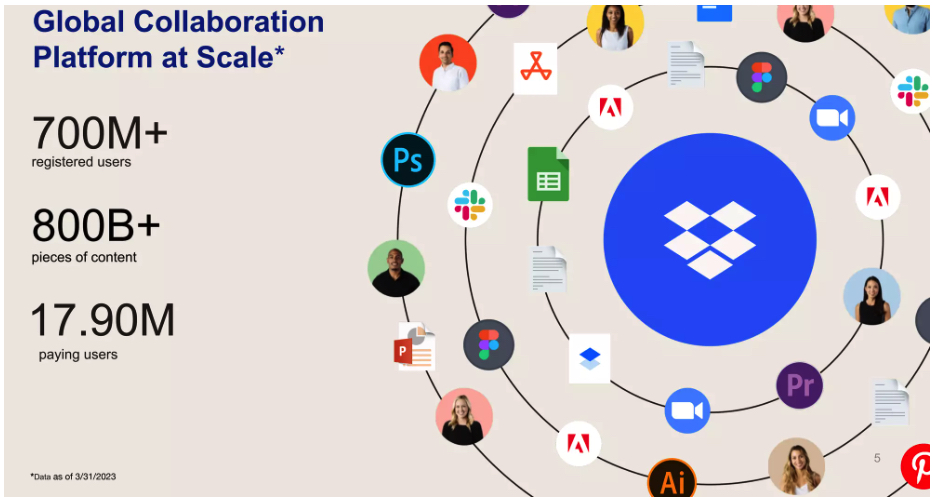
• Paying users ended at 17.90 million, as compared to 17.09 million for 1FQ22. Average revenue per paying user was $138.97, as compared to $134.63 for 1FQ22.
• GAAP gross margin was 80.9%, as compared to 79.9% for 1FQ22. Non-GAAP gross margin was 82.4%, as compared to 81.3% for 1FQ22.
• GAAP operating margin was 13.8%, as compared to 15.9% for 1FQ22. Non-GAAP operating margin was 28.6%, as compared to 30.3% for 1FQ22.
• GAAP net income was $69.0 million, as compared to $79.7 million for 1FQ22. Non-GAAP net income was $146.1 million, as compared to $141.5 million for 1FQ22.
• Net cash provided by operating activities was $139.9 million, as compared to $141.4 million for 1FQ22. Free cash flow was $138.0 million, as compared to $130.7 million for 1FQ22.
• GAAP diluted net income per share attributable to common stockholders was $0.20, as compared to $0.21 for 1FQ22. Non-GAAP diluted net income per share attributable to common stockholders was $0.42, as compared to $0.38 for 1FQ22.
• Cash, cash equivalents and short-term investments ended at $1.253 billion.
Comments
Total revenue for the first quarter increased 8.7% Y/Y and 2% Q/Q to $611 million, beating guidance range of $600 million to $603 million.

Houston commented: "We saw continued weakness across our team's plans as our customers face pressure in their own businesses. And we also saw a continued moderation in our DocSend and Dropbox Sign businesses due to ongoing softness in their respective markets."
The company announced recently its reduces its workforce by approximately 16%.
On a constant currency basis, revenue grew 11.6% Y/Y. The upside to revenue guidance was driven by an outperformance from FormSwift as well as some improving trends in individual plans exiting this quarter.
Total ARR for the quarter grew 7.8% Y/Y, for a total of $2.468 billion. On a constant currency basis, ARR grew by $37 million Q/Q and 11.6% Y/Y, primarily driven by FormSwift and pricing and packaging changes to teams plans announced last June.
The firm exited the quarter with 17.9 million paying users and added approximately 120,000 net new paying users Q/Q. Average revenue per paying user for 2FQ23 was $138.97, an increase of over $4 compared to 4FQ22. The driven by another quarter of Teams customers renewing at higher prices, which the company announced last June as well as a full quarter of FormSwift revenue.
For 2FQ23, Dropbox expects revenue to be in the range of $612 million to $615 million, up 7% Y/Y. On a constant currency revenue basis, it expects revenue to be in the range of $627 million to $630 million.
For FY23, due to the strengthening of the U.S. dollar since firm's last update, it is revising its reported revenue guidance range down by $5 million to $2.470 billion the $2.485 billion, or +6% to +6%, from previous range of $2.475 billion to $2.490 billion.
| Fiscal period |
Revenue in $ million |
Y/Y growth | Net loss in $ million |
| 2015 | 603.8 | NA | (352.9) |
| 2016 | 844.8 | 40% | (210.2) |
| 2017 | 1,107 | 13% | (111.7) |
| 2018 | 1,392 | 26% | (484.9) |
| 2019 |
1,661 | 19% | (52.7) |
| 2020 |
1,914 | 15% | (256.3) |
| FY21 |
2,158 | 13% | 335.8 |
| 1Q22 |
562.4 | 10% | 79.7 |
| 2Q22 |
572.7 | 8% | 62.0 |
| 3Q22 |
591.0 | 7% | 83.2 |
| 4Q22 |
598.8 | 6% | 328.3 |
| FY22 |
2,325 |
8% |
553.2 |
| 1Q23 | 611.1 | 9% | NA |
| 2Q23 (estim.) | 612-615 | 7% | NA |
| FY23 (estim.) | 2,470-2,485 | 6%-7% | NA |


 Subscribe to our free daily newsletter

