


Micron: Fiscal 4Q19 Financial Results
Third quarter in row of declining sales; suffering lower sales from Huawei
This is a Press Release edited by StorageNewsletter.com on September 30, 2019 at 2:31 pm| (in $ million) | 4Q18 | 4Q19 | FY18 | FY19 |
| Revenue | 8,440 | 4,870 | 30,391 | 23,406 |
| Growth | -42% | -23% | ||
| Net income (loss) | 4,325 | 561 | 14,135 | 6,313 |
Micron Technology, Inc. announced results for its fourth quarter and full year of fiscal 2019, which ended August 29, 2019.
4FQ19 highlights
• Revenues of $4.87 billion vs. $4.79 billion for the prior quarter and $8.44 billion for the same period last year
• GAAP net income of $561 million, or $0.49 per diluted share
• Non-GAAP net income of $637 million, or $0.56 per diluted share
• Operating cash flow of $2.23 billion vs. $2.71 billion for the prior quarter and $5.16 billion for the same period last year
FY19 highlights
• Revenues of $23.41 billion vs. $30.39 billion for the prior fiscal year
• GAAP net income of $6.31 billion, or $5.51 per diluted share
• Non-GAAP net income of $7.31 billion, or $6.35 per diluted share
• Operating cash flow of $13.19 billion vs. $17.40 billion for the prior fiscal year
• Share repurchases of $2.66 billion under the authorized buyback program
“Micron delivered fourth quarter results ahead of expectations, capping a fiscal 2019 in which we executed well in a challenging environment, improved our competitive position, and returned cash to shareholders through share repurchases,” said president and CEO Sanjay Mehrotra. “We are encouraged by signs of improving industry demand, but are mindful of continued near-term macroeconomic and trade uncertainties. As markets recover, Micron is well positioned to address the robust secular demand for memory and storage solutions.”
Investments in capital expenditures, net of amounts funded by partners, were $1.97 billion for 4FQ19 and $9.11 billion for FY9, which resulted in adjusted free cash flows of $263 million for 4FQ19 and $4.08 billion for FY19. Micron repurchased an aggregate of 67 million shares of its common stock for $2.66 billion during 2019 and ended 4FQ19 with cash, marketable investments, and restricted cash of $9.25 billion, for a net cash position of $3.40 billion.
Guidance for 1FQ20:
- Revenue of $5.0 billion ± $200 million
- Investments in capital expenditures, net of amounts funded by partners, to be in the range of $7 billion to $8 billion
Comments
According to our calculation, Micron was the number one company in the storage industry in 2017 and 2018 in term of revenue and will keep this leadership position this year even with sales in FY19 are down by as much as 33%, continuing to surpass now Dell (for storage business only) and then WD and Seagate.
For the most recent quarter, analysts expected Micron's sales of $4.52 billion, according to Zacks Investment Research, but final result is better and exceeds guidance.
It beat Wall Street's targets for FQ19 but earnings continue to plunge and stock falls.
Sales were down as much as 42% Y/Y for 4FQ19 (but up 2% sequentially) and 23% from FY18 even if it's the second best year in Micron's history for revenue, free cash flow, earnings.
Revenue by business unit
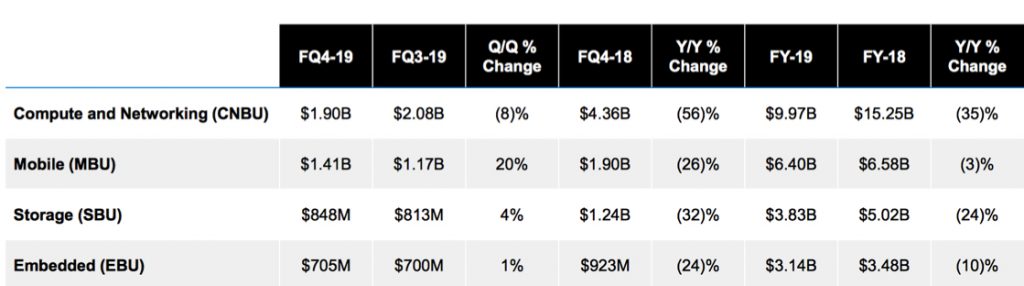
The firm has two main activities, DRAM representing 63% of overall revenue and NAND 31%, in front of storage business unit ($848 million) and embedded business unit ($705 million).
DRAM
4FQ19 revenue was $3.1 billion increasing 1% sequentially and declining 48% Y/Y.
DRAM demand bounced back as issues impacting first half 2019 dissipated.
Bit shipments grew 30% sequentially and in the mid-teens percentage range Y/Y, as customer inventories improved. ASP declined 20% sequentially.
For FY19, DRAM revenue was $15.2 billion, down 28% from FY18 as bits grew in the low-single-digit percentage range and ASP declined 30%.
For the same period, DRAM cost per bit declines led the industry and exceeded firm's internal plans, despite the headwinds from company's announced reduction in wafer starts.
Micron expects the industry to see bit demand growth of high teens to 20%, above supply growth of only mid-teens, which should help normalize supplier inventories and enable a healthy industry environment. It expects long-term DRAM bit demand growth CAGR to be mid- to high teens.
NAND
4FQ19 revenue was $1.5 billion, up 5% sequentially but declined yearly 32%.
Bit shipments grew in the low-to-mid-teens percentage range sequentially.
ASP declined in the upper-single-digit percentage range.
FY19 NAND revenue was $6.9 billion, down 12% from FY18, as ASP declines of mid-40% range more than offset bit shipment growth.
NAND elasticity drives robust demand growth, causing industry inventories to improve rapidly.
• Continued to outpace industry cost declines during FY19
• 96-layer 3D NAND is continuing to increase as a portion of the mix
• Achieved first yielding dies using replacement gate, further reducing risk of RG transition
Micron makes progress with its 3DXP product development and remain on track to launch initial products in calendar 2019.
Consumer SSD segment achieved record revenue and unit shipments with bits posting triple-digit percentage growth Y/Y.
In FY19, mobile revenue was down 3% from 2018's record performance, despite a drop in market pricing and the impact of Huawei (see below).
Managed NAND bit shipments in FY19 more than tripled yearly, driven by growth of MCP and discrete NAND eMMC and UFS products.
NAND outlook
- CY19 bit supply growth slightly above industry supply growth
- CY20 bit supply growth to be significantly below the industry as the firm uses its NAND inventory to support customer demand
- Minimal cost reductions in FY20 and meaningful cost reductions in FY21
Long-term Micron supply growth in line with industry demand
For Micron, CY19 industry bit demand will growth in the low mid 40% range, which will exceed bit supply growth of approximately 30%. CY20 industry bit demand growth is expected in high 20% to low 30% range, with supply growing somewhat below demand.
Storage Business Unit
Revenue in 4FQ19 was $848 million, an increase of 4% from 3FQ19 and down 32% Y/Y. For fiscal year, sales were $3.8 billion, down 24% from FY18.
Huawei Update
- In 4FQ19, sales to Huawei declined sequentially and were down meaningfully from the levels anticipated prior to the addition of Huawei to the Entity List.
- The company applied for licenses with the U.S. Department of Commerce that would allow to ship additional products, but there have been no decisions on those licenses to date.
- If the Entity List restrictions against Huawei continue and the firm unable to get licenses, it could see a worsening decline in or sales to Huawei over the coming quarters.
For next quarter the firm expects total revenue being between -1% and 7% from the former quarterly period.


 Subscribe to our free daily newsletter


