


WD: Fiscal 3Q15 Financial Results
Poor quarter, like Seagate
This is a Press Release edited by StorageNewsletter.com on April 29, 2015 at 3:08 pm| (in $ million) | 3Q14 | 3Q15 | 9 mo. 14 | 9 mo. 15 |
| Revenues | 3,703 | 3,550 | 11,479 | 11,381 |
| Growth | -4% | -1% | ||
| Net income (loss) | 375 | 384 | 1,300 | 1,245 |
Western Digital Corp. reported revenue of $3.5 billion and net income of $384 million, or $1.63 per share, for its third fiscal quarter ended April 3, 2015.
On a non-GAAP basis, net income was $441 million or $1.87 per share. In the year-ago quarter, the company reported revenue of $3.7 billion and net income of $375 million, or $1.55 per share. Non-GAAP net income in the year-ago quarter was $470 million, or $1.94 per share.
The company generated $684 million in cash from operations during the third fiscal quarter, ending with total cash and cash equivalents of $4.8 billion. It utilized $240 million to repurchase 2.2 million shares of common stock.
On Feb. 3, the company declared a cash dividend of $0.50 per share of its common stock, which was paid on April 16.
“I am satisfied with our execution and results in light of current PC demand challenges that were largely driven by weak macro-economic conditions,” said Steve Milligan, president and CEO. “We delivered a solidly profitable quarter with continued strong cash generation, improved ASP and healthy gross margins.
“We continue to carefully balance the management of short term market dynamics with a strong focus on long term value creation. This is reflected in our balanced approach to capital allocation. Fiscal year to date, we returned $1.1 billion to our shareholders in share repurchases and dividends, while continuing to invest in high growth market opportunities.”
Comments
As expected, 3Q15 is a poor quarter for WD, as it was for Seagate, the global market of HDDs shrinking the first three months of 2015 at 125 million units shipped, down 11% Q/Q, with client volumes affected by weak PCs and seasonal declines in CE and branded, according to Trendfocus.
All the main figures of WD, continuing to lead the HDD industry, are down sequentially: revenue, HDD shipped and even exabytes shipped. Exceptions: net income, average gigabytes per drive (from 1,087GB to 1,123GB), average price per HDD (from $60 to $61), and enterprise SSD revenue growing (from $187 million to $224 million.)
Steve Milligan, president and CEO, said:" We surpassed one million helium hard drive deployments and are now ramping our new 8TB helium PMR sealed drives."
"Our ability to respond to changing market dynamics is affected by the MOFCOM hold separate restriction," he added. "This is one of the central arguments that I continue to make in our regular interactions with MOFCOM. Lifting the hold separate restriction would be beneficial to consumers and our customers by promoting innovation and enhancing the competitive environment."
Next quarter could be worst as WD expects HDD total available market to be down to around 120 million, which will most likely mean that the 2015 HDD shipments will contract from 2014 like the three past years. The HDD maker expects revenue down sequentially next quarter, between $3.3 and $3.4 billion (between $3.3 and $3.4 billion for Seagate.)
WD Volume and HDD Share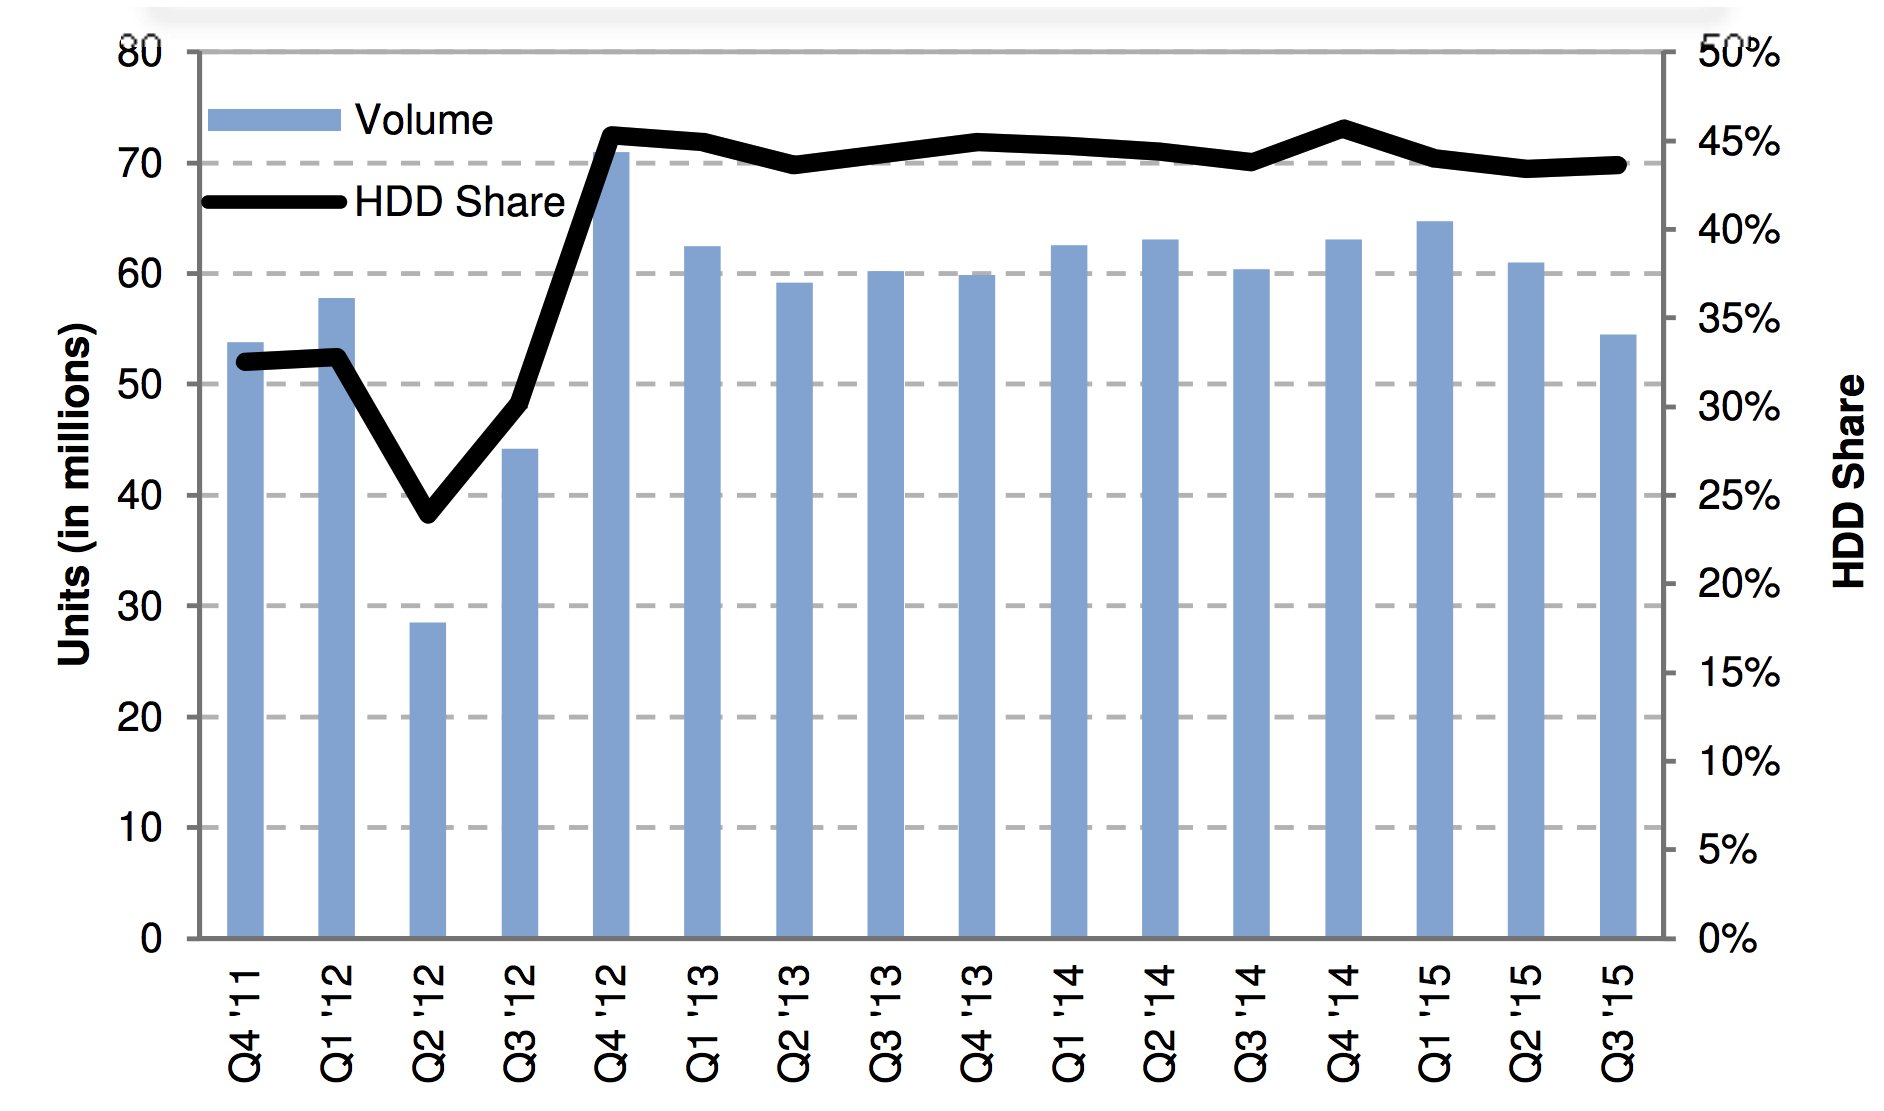
To read the earnings call transcript
WD's HDDs from 3FQ13 to 3FQ15
(units in million)
| WD's HDDs (units in million) |
Enterprise | Desktop | Notebook | CE | Branded | Exabyte Shipped |
Average GB/drive |
ASP |
| 3Q13 | 7.2 | 18.4 | 21.5 | 6.5 | 6.5 | 48.4 | 807 | $61 |
| 4Q13 | 7.9 | 16.2 | 24.0 | 6.5 | 5.3 | 47.7 | 797 | $60 |
| 1Q14 | 7.8 | 17.3 | 22.9 | 8.5 | 6.1 | 50.8 | 811 | $58 |
| 2Q14 | 7.8 | 16.8 | 22.7 | 8.8 | 7.0 | 55.1 | 874 | $60 |
| 3Q14 | 7.1 | 16.6 | 21.8 | 8.6 | 6.3 | 53.6 | 888 | $58 |
| 4Q14 | 7.1 | 16.2 | 22.9 | 10.9 | 6.0 | 55.2 | 875 | $56 |
| 1Q15 | 7.8 | 16.3 | 23.4 | 10.5 | 6.8 | 64.9 | 1,002 | $58 |
| 2Q15 | 8.0 | 15.4 | 21.2 | 9.3 | 7.2 | 66.4 | 1,087 | $60 |
| 3Q15 | 7.5 | 13.5 | 18.8 | 8.6 | 6.1 | 61.3 | 1,123 | $61 |
Seagate vs.WD for 3FQ15
(revenue and net income in $ million, units in million)
| Seagate | WD | % in favor of WD |
|
| Revenue | 3,330 | 3,550 | 6% |
| Net income | 291 | 384 | 32% |
| Notebook | 16.8 | 18.8 | 12% |
| Desktop | 14.3 | 13.5 | -6% |
| Branded | 5.1 | 6.1 | 20% |
| CE | 4.8 | 8.6 | 79% |
| Enterprise | 9.1 | 7.5 | -18% |
| Total HDDs | 50.1 | 54.5 | 9% |
| Market share | 40.1% | 43.6% | 9% |
| Average GB/drive | 1,102 | 1,123 | 2% |
| EB shipped | 55.2 | 61.3 | 11% |
| ASP | $62 | $61 | -2% |


 Subscribe to our free daily newsletter

