


HPE: Fiscal 2Q26 Financial Results
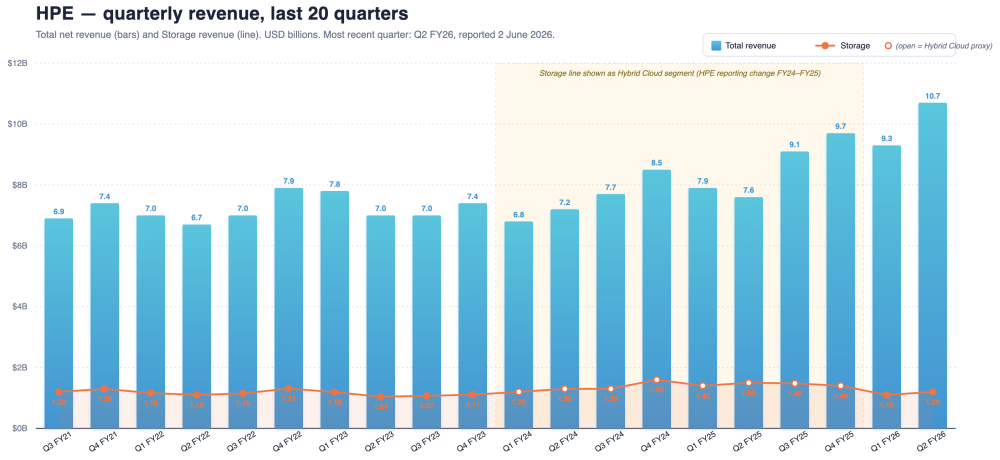
Generating $10.7 billion, up 15% QoQ and up 40% YoY
This is a Press Release edited by StorageNewsletter.com on June 3, 2026 at 2:02 pmHPE announced financial results for the second quarter ended April 30, 2026.![]() “HPE delivered an exceptional quarter with record-breaking revenue, higher-than-anticipated profitability, and increased free cash flow, reflecting strong execution and healthy demand across the business,” said Antonio Neri, president and CEO, HPE. “Customers continue to invest in modernizing their infrastructure and scaling AI, and our performance shows the strength of our combined networking portfolio and the value we are delivering to our shareholders.”
“HPE delivered an exceptional quarter with record-breaking revenue, higher-than-anticipated profitability, and increased free cash flow, reflecting strong execution and healthy demand across the business,” said Antonio Neri, president and CEO, HPE. “Customers continue to invest in modernizing their infrastructure and scaling AI, and our performance shows the strength of our combined networking portfolio and the value we are delivering to our shareholders.”
“We drove high profitability and cash generation this quarter through continued operational discipline as well as executing ahead of schedule against Juniper Networks and Catalyst cost synergies,” said Marie Myers, EVP and CFO, HPE. “Based on our performance, we are raising our fiscal 2026 guidance and introducing a fiscal 2027 financial growth framework. These updates reflect the durability of our performance and continued operational excellence – and point to faster progress toward our long-term financial plan.”
In the quarter, HPE achieved record revenue, gross margin, and non-GAAP diluted net EPS, as well as its highest-ever free cash flow generation for a second quarter.
Click to enlarge
Second Quarter Fiscal 2026 Financial Results
- Revenue: $10.7 billion, up 40% from the prior-year period
- Gross margins:
- GAAP of 36.5%, up 810 basis points from the prior-year period and up 60 basis points sequentially
- Non-GAAP(1) of 36.9%, up 750 basis points from the prior-year period and up 30 basis points sequentially
- Diluted net earnings per share (“EPS”):
- GAAP of $0.44, up $1.26 from the prior-year period and above our outlook range of $0.09 – $0.13
- Non-GAAP(1) of $0.79, up $0.41 from the prior-year period and above our outlook range of $0.51 – $0.55
- Cash flow from operations: $1.4 billion, an increase of $1.9 billion from the prior-year period
- Free cash flow(1)(2): $0.9 billion, an increase of $1.8 billion from the prior-year period
- Capital returns to common shareholders: $343 million in the form of dividends and share repurchases
Click to enlarge
Second Quarter Fiscal 2026 Segment Results
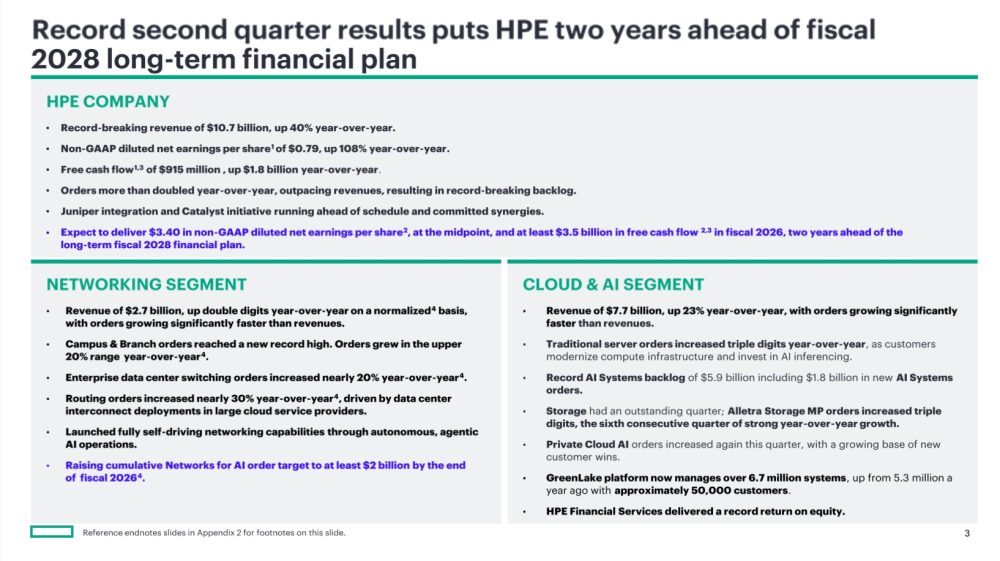
- Networking revenue was $2.7 billion, up 148.2% from the prior-year period, with 21.6% operating profit margin, compared to 25.0% from the prior-year period
- Within Networking, revenue from:
- Campus & Branch was $1.3 billion, up 50.2% from the prior-year period
- Data Center Networking was $320 million, up 233.3% from the prior-year period
- Security was $273 million, up 155.1% from the prior-year period
- Routing was $775 million, compared to $1 million in the prior-year period
- Within Networking, revenue from:
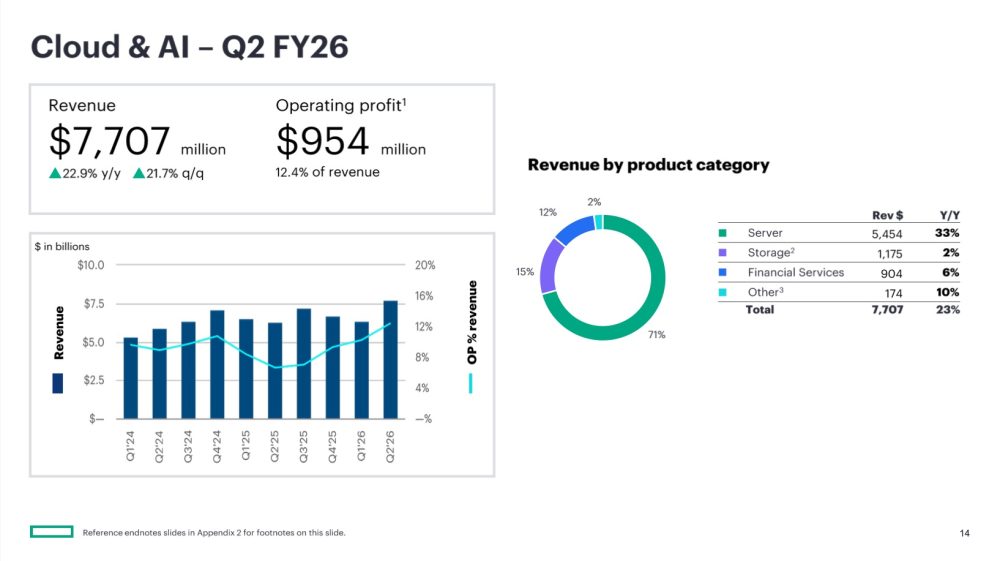
- Cloud & AI revenue was $7.7 billion, up 22.9% from the prior-year period, with 12.4% operating profit margin, compared to 6.6% from the prior-year period
- Within Cloud & AI, revenue from:
- Server was $5.5 billion, up 32.7% from the prior-year period
- Storage was $1.2 billion, up 2.4% from the prior-year period
- Financial Services was $0.9 billion, up 5.6% from the prior-year period
- Within Cloud & AI, revenue from:
- Corporate Investments and Other revenue was $281 million, up 3.3% from the prior-year period, with -3.2% of operating profit margin, compared to -2.6% from the prior-year period
Dividend
The HPE Board of Directors declared a regular cash dividend of $0.1425 per share on the company’s common stock, payable on or about July 15, 2026, to stockholders of record as of the close of business on June 16, 2026.
Fiscal 2026 Third Quarter Outlook
HPE estimates revenue to be in the range of $11.5 billion to $12.1 billion. HPE estimates GAAP diluted net EPS to be in the range of $0.84 to $0.89 and non-GAAP diluted net EPS(1) to be in the range of $0.88 to $0.93. Fiscal 2026 third quarter non-GAAP diluted net EPS estimate excludes net after-tax adjustments of approximately $0.04 per diluted share, primarily related to amortization of intangible assets, stock-based compensation expense, acquisition, disposition and other charges, cost reduction program, and adjustments related to the sale of H3C.
Fiscal 2026 Full Year Outlook
HPE is raising its FY26 revenue growth outlook range to 29% to 33%. HPE is raising revenue growth expectations for the Networking segment to 72% to 75%. HPE estimates GAAP operating profit growth to be 885% to 930% and non-GAAP operating profit growth between 80% to 85%(1)(3).
HPE is raising both GAAP diluted net EPS to be in the range of $2.42 to $2.52 and non-GAAP diluted net EPS(1)(4) to be in the range of $3.35 to $3.45. Fiscal 2026 non-GAAP diluted net EPS estimate excludes net after-tax adjustments of approximately $0.93 per diluted share, primarily related to amortization of intangible assets, stock-based compensation expense, acquisition, disposition and other charges, cost reduction program, and adjustments related to the sale of H3C. HPE is also raising its free cash flow(1)(2)(4) guidance and now expects free cash flow to be at least $3.5 billion.
The updated FY26 outlook ranges for non-GAAP diluted net EPS and free cash flow are higher than what HPE projected the company would achieve by FY28 when it released long-term financial guidance at the HPE Securities Analyst Meeting in October 2025. The company had expected to generate at least $3.00 in non-GAAP diluted net EPS and more than $3.5 billion in free cash flow by FY28.
Fiscal 2027 Outlook Framework
The company is introducing its growth framework for FY27. HPE estimates revenue growth to be in the range of 8% to 12%. HPE estimates non-GAAP diluted net EPS(1)(4) growth to be in the range of 12% to 16% and non-GAAP operating margin rate to be in the range of 12% to 16%(1)(4). HPE estimates it will generate free cash flow(1)(2)(4) of at least $4.5 billion.
H3C Technologies Co., Limited Update
HPE also notes that the divestiture of its stake in H3C Technologies Co., Limited was completed on May 28. Cash proceeds totaling approximately $1.357 billion were received in exchange for the sale of HPE’s remaining 19% of total H3C shares outstanding. HPE received a total pretax consideration of approximately $3.5 billion for its stake in the company since it announced its intention to exit the joint venture.
1 A description of HPE’s use of non-GAAP financial information is provided below under “Use of non-GAAP financial information and key performance metrics.”
2 Free cash flow represents cash flow from operations, less net capital expenditures (investments in property, plant & equipment (“PP&E”) and software assets less proceeds from the sale of PP&E), and adjusted for the effect of exchange rate fluctuations on cash, cash equivalents, and restricted cash
3 FY26 non-GAAP operating profit excludes costs of approximately $2.6 billion primarily related to amortization of intangible assets, stock-based compensation expense, acquisition, disposition and other charges, and cost reduction program.
4 HPE provides certain guidance on a non-GAAP basis. In reliance on the exception provided by Item 10(e)(1)(i)(B) of Regulation S-K, Hewlett Packard Enterprise is unable to provide a reconciliation to the most directly comparable GAAP financial measure without unreasonable efforts, as the Company cannot predict some elements that are included in such directly comparable GAAP financial measure. These elements could have a material impact on the Company’s reported GAAP results for the guidance period. Refer to the discussion of non-GAAP financial measures below for more information
Comments
HPE delivered a very solid second quarter for fiscal 2026, with total revenue reaching $10.7 billion, up 40% YoY. The strong performance was driven by the full integration of Juniper Networks into the Networking segment and accelerating AI-related demand across the Cloud & AI segment. HPE now considers itself two years ahead of its FY2028 long-term financial plan, prompting raised full-year FY26 guidance alongside the introduction of an FY27 framework targeting 8–12% revenue growth. Imagine HPE revenue without Juniper...
The Cloud & AI segment, HPE's largest at $7.7 billion in quarterly revenue (up 23% YoY), was the central growth engine, with operating margin expanding sharply to 12.4% from 6.6% a year ago. Within it, the Server sub-segment was the standout at $5.5 billion, growing 33% YoY as hyperscalers, sovereign entities, and enterprises ramped up AI infrastructure investments. AI Systems orders alone reached $1.8 billion in the quarter, pushing the total AI backlog to a record $6.3 billion, with a notable 61% of cumulative orders originating from sovereign and enterprise customers rather than hyperscalers, suggesting durable, diversified demand. The GreenLake platform now manages over 6.7 million systems across approximately 50,000 customers, up from 5.3 million a year ago, reinforcing HPE's as-a-service positioning in private cloud AI.
Storage, while the quieter part of the story at $1.175 billion in revenue (up only 2% YoY), showed meaningful qualitative momentum. Alletra Storage MP orders grew triple digits for the sixth consecutive quarter, signaling a sustained architectural shift toward HPE's next-generation storage platform even if headline revenue growth remains modest due to mix and timing dynamics. The FY26 full-year outlook for Cloud & AI projects revenue growth in the low 20% range with operating margins in the low-to-mid teens, while FY27 targets 8–12% growth with margins expanding further to 10–15%. Taken together, the AI backlog trajectory, the Alletra order cadence, and the GreenLake platform scale paint a picture of HPE successfully repositioning itself as an integrated infrastructure provider for the AI era, with storage increasingly tied to AI workload requirements rather than traditional enterprise refresh cycles.
But globally storage revenue oscillated around $1B per quarter and appears to not be pulled positively and significantly by the AI wave.
And to put things in perspective considering the few other companies with storage product line with recent quarterly earnings:
- HPE and Everpure are almost equal (~$1.1B)
- NetApp has generated almost the double ($1.95B) and
- Dell 4 times ($4.3B)
- Hitachi Vantara, Huawei, IBM and Lenovo don't clearly report storage revenue for different reasons (private status, global business unit with storage being just one line...)


 Subscribe to our free daily newsletter

