









Western Digital: Fiscal 2Q20 Financial Results
Sales perfectly flat Y/Y, exabytes shipped down 1% for HDDs up 24% for NAND
This is a Press Release edited by StorageNewsletter.com on February 3, 2020 at 2:29 pm| (in $ million) | 2Q19 | 2Q20 | 6 mo. 19 | 6 mo. 20 |
| Revenue | 4,233 | 4,234 | 9,261 | 8,274 |
| Growth | 0% | -11% | ||
| Net income (loss) | (487) | (139) | 24 | 24 |
Western Digital Corp. reported revenue of $4.2 billion for its second fiscal quarter ended January 3, 2020.
Operating income was $50 million with a net loss of $139 million, or ($0.47) per share. Excluding certain non-GAAP adjustments, the company achieved non-GAAP operating income of $333 million and non-GAAP net income of $187 million, or $0.62 per share.
In 2Q19, the company reported revenue of $4.2 billion, operating income of $176 million and a net loss of $487 million, or ($1.68) per share. Non-GAAP operating income in the year-ago quarter was $589 million and non-GAAP net income was $424 million, or $1.45 per share.
The company generated $257 million in cash from operations during the second fiscal quarter of 2020, and ended the quarter with $3.1 billion of total cash and cash equivalents. It returned $149 million to shareholders through dividends and used $388 million to reduce debt. On November 14, 2019, the company declared a cash dividend of $0.50 per share of its common stock, which was paid to shareholders on January 21, 2020.
“The December quarter results reflect strong execution in our product roadmap, success in increasing our HDD gross margin, and an improving flash market,” said Steve Milligan, CEO. “We expect an accelerated recovery in our flash gross margins, which coupled with ongoing strength in demand for both HDDs and flash, positions us well for continued profitable growth in calendar year 2020.”
Comments
Last quarter of calendar year was bad one for HDD market, for WD, and will be even worst Seagate and Toshiba.
On the earnings call transcript, CEO Steve Milligan began with this phrase: "Western Digital delivered solid results in the second quarter as revenue came in at the midpoint of the guidance range and non-GAAP EPS was at the upper end of the range."
Quarterly global revenue reached $4.2 billion, up 5% Q/Q and perfectly flat from one year ago. (note that September quarter was a 14-week quarter)
Total exabytes for storage were up 1% sequentially, totaling 133.6EB, 118.3EB (-1%) for HDDs, and 15.3EB (+24%) for NAND.
WD divided its activity into 3 businesses;
1/ Data Center Devices and Solutions
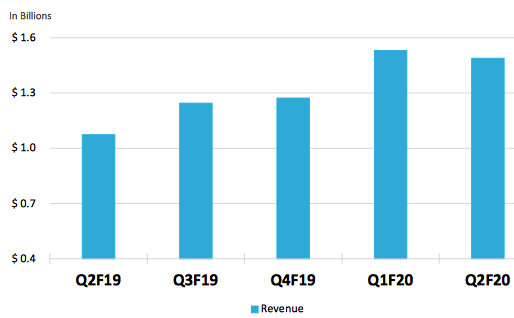
Datacenter devices and solutions, at $1.5 billion, decreased $43 million Q/Q as growth in enterprise SSDs was offset by decline in capacity enterprise drives and exit of storage systems business. But 14TB platform is performing well, driving 40% Y/Y exabyte growth. The firm experienced strong demand for air-based 10TB drive. Revenue shipments of 18TB and 16TB drives will start in the March quarter. WD expects to double its enterprise SSD revenue in CY20, as it moves towards goal of 20% market share.
2/ Client devices
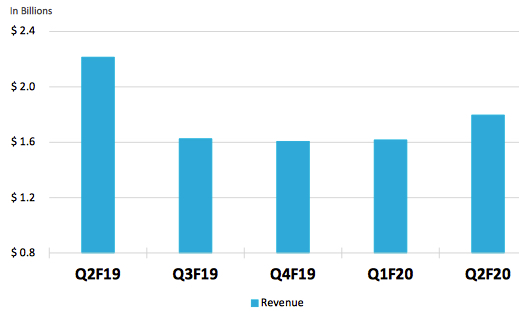
For client devices ($1.8 billion, up $181 million or 11% Q/Q and -20% Y/Y), the firm recorded growth in both HDDs and due to increased demand for client SSD smart video, mobility, and desktop HDDs. In the June quarter, it expects to begin shipments into a new gaming platform for Microsoft and Sony.
3/ Client solutions
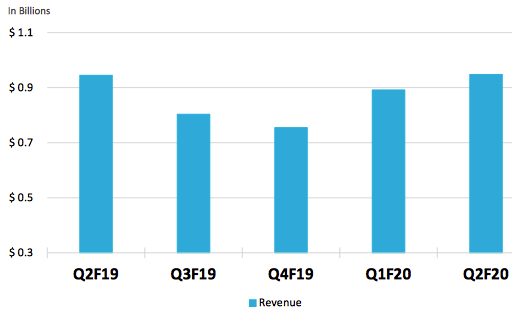
For client solutions, $948 million revenue increased by $56 million or +6% Q/Q and -15% Y/Y, driven primarily by strength in demand for HDDs and external SSDs. NVMe-based enterprise SSD sales grew over 50% Q/Q with inventory in flash supply returned to normal.
HDD metrics
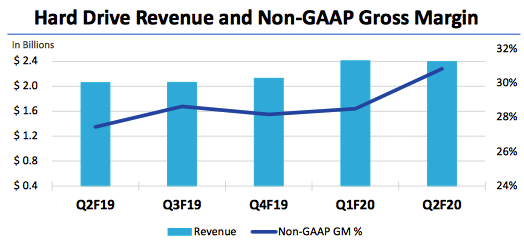
HDD revenue was $2.396 billion, roughly flat sequentially and up 16% Y/Y. Total exabyte shipment were down 1% Q/Q with ASP/drive flat at $81, but capacity enterprise exabyte shipments was up at more than 100% Y/Y. It started sampling 16TB, 18TB CMR and 20TB SMR energy-assisted HDDs, expecting revenue shipments of CMR units next quarter.
Flash metrics
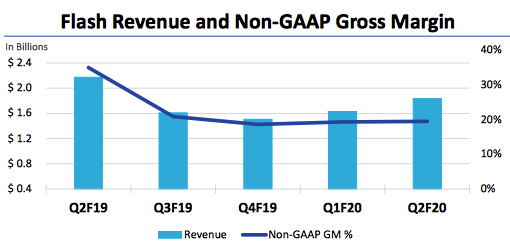
Flash revenue was $1.838 billion, up 13% sequentially and down 15% Y/Y. Bit shipments was up 24% and ASP/GB down 8% Q/Q.
At the end of the quarter, the company recorded $3.1 billion in cash and cash equivalents.
Outlook
It now expects an accelerated recovery in flash gross margins in calendar 1H20, with improvement through year 2020, and also to double enterprise SSD revenue in 2020 as it move towards its goal of 20% market share. Business outlook for 3FQ20 is the same as announced last quarter for 2FQ20: flat revenue growth between $4.1 and $4.3 billion.
HDD and flash revenue
| in $ million | 1FQ18 | 1FQ19 | 2FQ19 |
3FQ19 |
4FQ19 |
1FQ20 |
2FQ20 |
1Q20/2Q20 growth |
| HDD |
2,610 | 2,494 | 2,060 | 2,064 |
2,128 |
2,408
|
2,396 |
-1% |
| Flash |
2,571 | 2,534 | 2,173 | 1,610 | 1,506 | 1,632 | 1,838 | 13% |
| Exabyte metrics | 1FQ19 | 2FQ19 | 3FQ19 | 4FQ19 |
1FQ20 |
2FQ20 |
| Q/Q change in HDD exabytes sold (1) | -6% | -17% | 13% | 14% | 23% | -1% |
| Q/Q change in flash exabytes sold (1) | 28% | 5% | -5% | -1% | 9% | 24% |
| Q/Q change in total exabytes sold (1) | -3% | -15% | 11% | 12% | 22% | 1% |
| Flash metrics | 1FQ19 | 2FQ19 | 3FQ19 | 4FQ19 |
1FQ20 |
2FQ20 |
| Q/Q change in ASP/GB (1) | -16% | -18% | -23% | -6% | 0% | -8% |
(1) Excludes licensing, royalties, and non-memory products.
Volume and HDD Share
(units in million)
| Client compute units (5) |
Non-compute units (6) |
Data centers units (7) |
Total HDDs (8) |
Exabytes Shipped |
ASP (9) |
|
| 2FQ18 |
21.1 | 14.4 | 6.8 | 42.3 |
NA | $63 |
| 3FQ18 |
17.6 | 11.2 | 7.6 | 36.4 |
NA | $72 |
| 4FQ18 |
17.8 | 13.7 | 7.5 | 39.0 |
NA | $70 |
| 1FQ19 | 16.3 | 11.2 | 6.6 | 34.1 | 103.3 | $72 |
| 2FQ19 |
14.0 | 11.3 | 5.1 | 30.2 |
75.9 |
$67 |
| 3FQ19 |
12.9 | 9.3 | 5.6 | 27.8 | 97.5 | $73 |
| 4FQ19 |
12.3 | 9.2 | 6.2 | 27.7 | 111.5 | $75 |
| 1FQ20 |
12.9 | 8.9 | 7.5 | 29.3 | 131 | $81 |
| 2FQ20 |
11.8 | 10.3 | 7.1 |
29.2 |
133.6 |
$81 |
(6) Non-compute products consist of retail channel and consumer electronics HDDs.
(7) Data center products consist of enterprise HDDs (high-capacity and performance) and enterprise systems
(8) HDD unit volume excludes data storage systems and media
(9) HDD ASP is calculated by dividing HDD revenue by HDD units. Data storage systems are excluded from this calculation, as data storage systems ASP is measured on a per system basis rather than a per drive basis








 Subscribe to our free daily newsletter